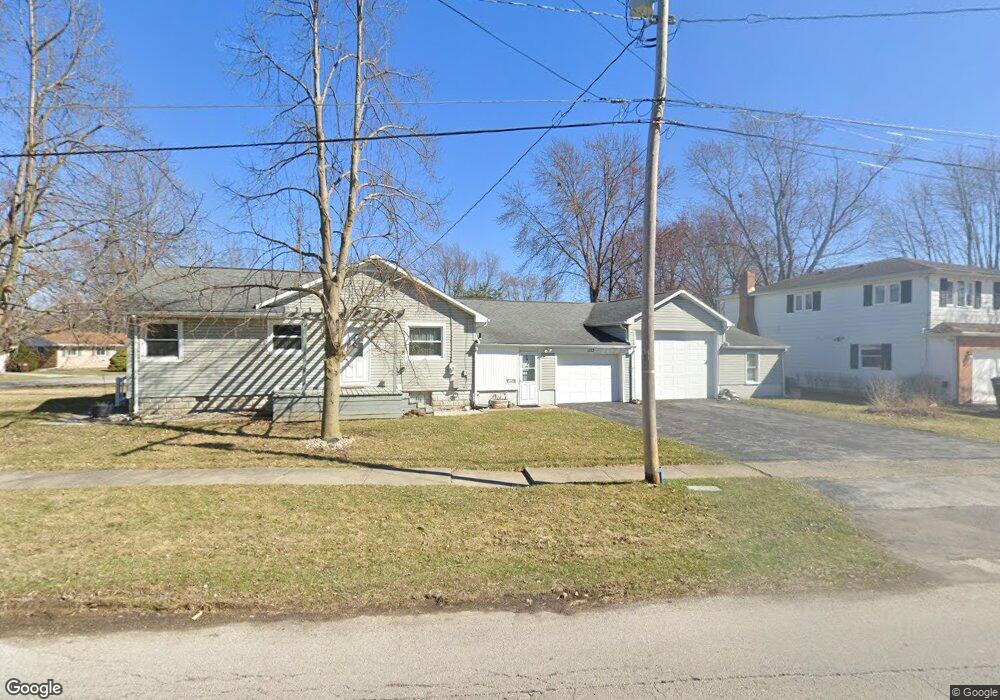
1133 Brookside Dr Findlay, OH 45840
Estimated Value: $152,000 - $208,781
2
Beds
2
Baths
1,098
Sq Ft
$164/Sq Ft
Est. Value
About This Home
This home is located at 1133 Brookside Dr, Findlay, OH 45840 and is currently estimated at $180,445, approximately $164 per square foot. 1133 Brookside Dr is a home located in Hancock County with nearby schools including Whittier Elementary School, Wilson Vance Elementary School, and Donnell Middle School.
Ownership History
Date
Name
Owned For
Owner Type
Purchase Details
Closed on
Aug 18, 2006
Sold by
Bork John
Bought by
Yildiz Sibel
Current Estimated Value
Home Financials for this Owner
Home Financials are based on the most recent Mortgage that was taken out on this home.
Original Mortgage
$20,300
Interest Rate
6.4%
Mortgage Type
Stand Alone Second
Purchase Details
Closed on
Nov 4, 2002
Sold by
Kring Glen A
Bought by
Bork John
Home Financials for this Owner
Home Financials are based on the most recent Mortgage that was taken out on this home.
Original Mortgage
$78,400
Interest Rate
5.56%
Mortgage Type
New Conventional
Purchase Details
Closed on
Oct 30, 1986
Bought by
Kring Paul and Kring Della
Purchase Details
Closed on
Feb 23, 1981
Bought by
Hempfling Terry J and Hempfling Agnes
Create a Home Valuation Report for This Property
The Home Valuation Report is an in-depth analysis detailing your home's value as well as a comparison with similar homes in the area
Home Values in the Area
Average Home Value in this Area
Purchase History
| Date | Buyer | Sale Price | Title Company |
|---|---|---|---|
| Yildiz Sibel | $101,500 | Mid Am Title Agency | |
| Bork John | $98,000 | -- | |
| Kring Paul | $55,600 | -- | |
| Hempfling Terry J | -- | -- |
Source: Public Records
Mortgage History
| Date | Status | Borrower | Loan Amount |
|---|---|---|---|
| Closed | Yildiz Sibel | $20,300 | |
| Open | Yildiz Sibel | $81,200 | |
| Previous Owner | Bork John | $78,400 |
Source: Public Records
Tax History
| Year | Tax Paid | Tax Assessment Tax Assessment Total Assessment is a certain percentage of the fair market value that is determined by local assessors to be the total taxable value of land and additions on the property. | Land | Improvement |
|---|---|---|---|---|
| 2024 | $1,906 | $53,660 | $9,090 | $44,570 |
| 2023 | $1,909 | $53,660 | $9,090 | $44,570 |
| 2022 | $1,902 | $53,660 | $9,090 | $44,570 |
| 2021 | $1,729 | $42,420 | $9,100 | $33,320 |
| 2020 | $1,726 | $42,420 | $9,100 | $33,320 |
| 2019 | $1,692 | $42,420 | $9,100 | $33,320 |
| 2018 | $1,606 | $36,900 | $7,920 | $28,980 |
| 2017 | $1,604 | $36,900 | $7,920 | $28,980 |
| 2016 | $1,589 | $36,900 | $7,920 | $28,980 |
| 2015 | $1,675 | $38,310 | $7,280 | $31,030 |
| 2014 | $1,675 | $38,310 | $7,280 | $31,030 |
| 2012 | $1,691 | $38,310 | $7,280 | $31,030 |
Source: Public Records
Map
Nearby Homes
- 1100 Stall Dr
- 1037 Fishlock Ave
- 1200 1st St
- 15591 Canadian Way
- 15586 Canadian Way
- 15615 Canadian Way
- 0 Blanchard Ave
- 731 5th St
- 1709 Eastview Dr
- 1726 Eastview Dr
- 1421 Autumn Dr
- 1001 Decker Ave
- 216 1st St
- 1421 E Sandusky St
- 829 Maple Ave
- 206 Greenlawn Ave
- 309 Huron Rd
- 123 Glendale Ave
- 331 Fairlawn Place
- 865 S Main St
- 1409 Blanchard Ave
- 1401 Blanchard Ave
- 1413 Blanchard Ave
- 1141 Brookside Dr
- 1404 Blanchard Ave
- 1131 Brookside Dr
- 1132 Brookside Dr
- 1408 Blanchard Ave
- 1417 Blanchard Ave
- 1120 Brookside Dr
- 1412 Blanchard Ave
- 1127 Brookside Dr
- 1319 Blanchard Ave
- 1006 Brookview Ct
- 1425 Blanchard Ave
- 1012 Brookview Ct
- 1324 Blanchard Ave
- 1416 Blanchard Ave
- 1422 Blanchard Ave
- 1123 Brookside Dr
Your Personal Tour Guide
Ask me questions while you tour the home.