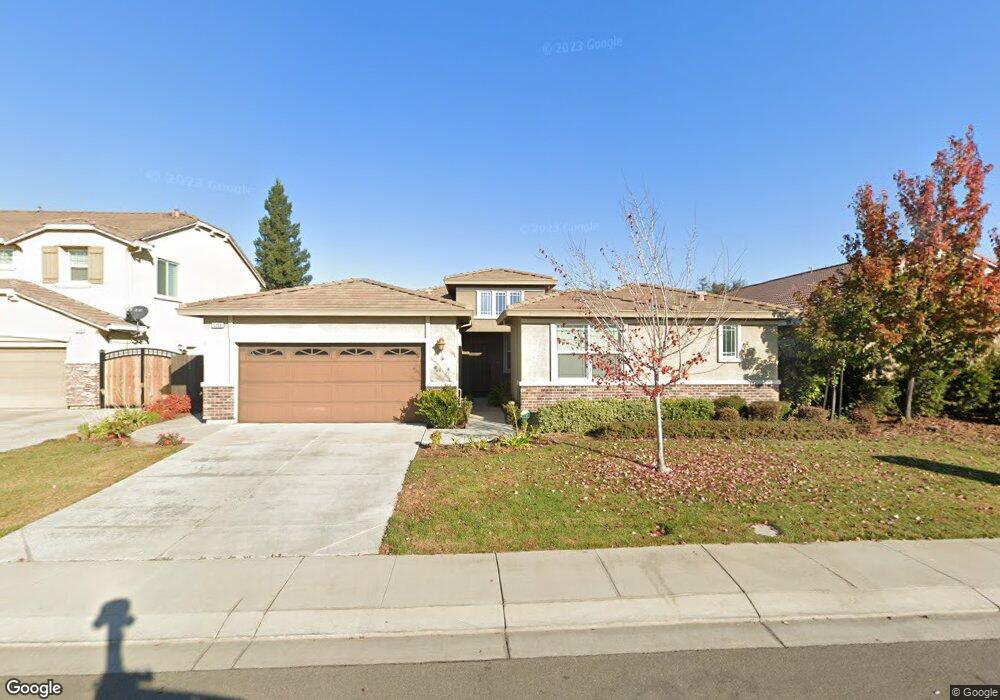
1133 Mono St Manteca, CA 95337
Estimated Value: $698,910 - $781,000
4
Beds
4
Baths
2,660
Sq Ft
$280/Sq Ft
Est. Value
About This Home
This home is located at 1133 Mono St, Manteca, CA 95337 and is currently estimated at $745,478, approximately $280 per square foot. 1133 Mono St is a home with nearby schools including Park View Elementary School, Weston Elementary School, and Ripon Elementary School.
Ownership History
Date
Name
Owned For
Owner Type
Purchase Details
Closed on
Dec 3, 2019
Sold by
Liu Xing
Bought by
Yang Rodney Yinghu and Liu Xing
Current Estimated Value
Purchase Details
Closed on
Jun 10, 2016
Sold by
Yang Rodney Yinghu
Bought by
Liu Xing
Home Financials for this Owner
Home Financials are based on the most recent Mortgage that was taken out on this home.
Original Mortgage
$223,000
Outstanding Balance
$99,950
Interest Rate
3.61%
Mortgage Type
New Conventional
Estimated Equity
$645,528
Purchase Details
Closed on
Apr 3, 2014
Sold by
Meritage Homes Of California Inc
Bought by
Yang Rodney Yinghu and Liu Xing
Home Financials for this Owner
Home Financials are based on the most recent Mortgage that was taken out on this home.
Original Mortgage
$248,000
Interest Rate
4.3%
Mortgage Type
New Conventional
Create a Home Valuation Report for This Property
The Home Valuation Report is an in-depth analysis detailing your home's value as well as a comparison with similar homes in the area
Purchase History
| Date | Buyer | Sale Price | Title Company |
|---|---|---|---|
| Yang Rodney Yinghu | -- | None Available | |
| Liu Xing | -- | Wfg National Title Ins Co | |
| Yang Rodney Yinghu | $355,000 | First American Title Company |
Source: Public Records
Mortgage History
| Date | Status | Borrower | Loan Amount |
|---|---|---|---|
| Open | Liu Xing | $223,000 | |
| Closed | Yang Rodney Yinghu | $248,000 |
Source: Public Records
Tax History
| Year | Tax Paid | Tax Assessment Tax Assessment Total Assessment is a certain percentage of the fair market value that is determined by local assessors to be the total taxable value of land and additions on the property. | Land | Improvement |
|---|---|---|---|---|
| 2025 | $6,434 | $434,932 | $152,224 | $282,708 |
| 2024 | $6,368 | $426,405 | $149,240 | $277,165 |
| 2023 | $6,261 | $418,045 | $146,314 | $271,731 |
| 2022 | $6,149 | $409,849 | $143,446 | $266,403 |
| 2021 | $6,054 | $401,814 | $140,634 | $261,180 |
| 2020 | $5,996 | $397,694 | $139,192 | $258,502 |
| 2019 | $5,888 | $389,897 | $136,463 | $253,434 |
| 2018 | $5,837 | $382,253 | $133,788 | $248,465 |
| 2017 | $5,770 | $374,759 | $131,165 | $243,594 |
| 2016 | $5,688 | $367,411 | $128,593 | $238,818 |
| 2015 | $5,518 | $361,894 | $126,662 | $235,232 |
| 2014 | $2,055 | $61,100 | $61,100 | $0 |
Source: Public Records
Map
Nearby Homes
- 935 Mono St
- 806 Mono St
- 2317 Mathar Dr
- 2377 Beardsley Ave
- 2365 Beardsley Ave
- 864 Heartland Dr
- 607 Mono St
- 2633 Coolidge Place
- 1807 Birdie Ave
- 1271 Veteran St
- 1076 Balzo St
- 1589 Friendly St
- 1773 Lana Way
- 2446 Paramount Ln
- 1581 Veteran St
- 1175 Miel St
- 1816 Fire Power Ave
- 2532 Branden Place
- 277 Fragrance St
- 837 Grafton St
Your Personal Tour Guide
Ask me questions while you tour the home.