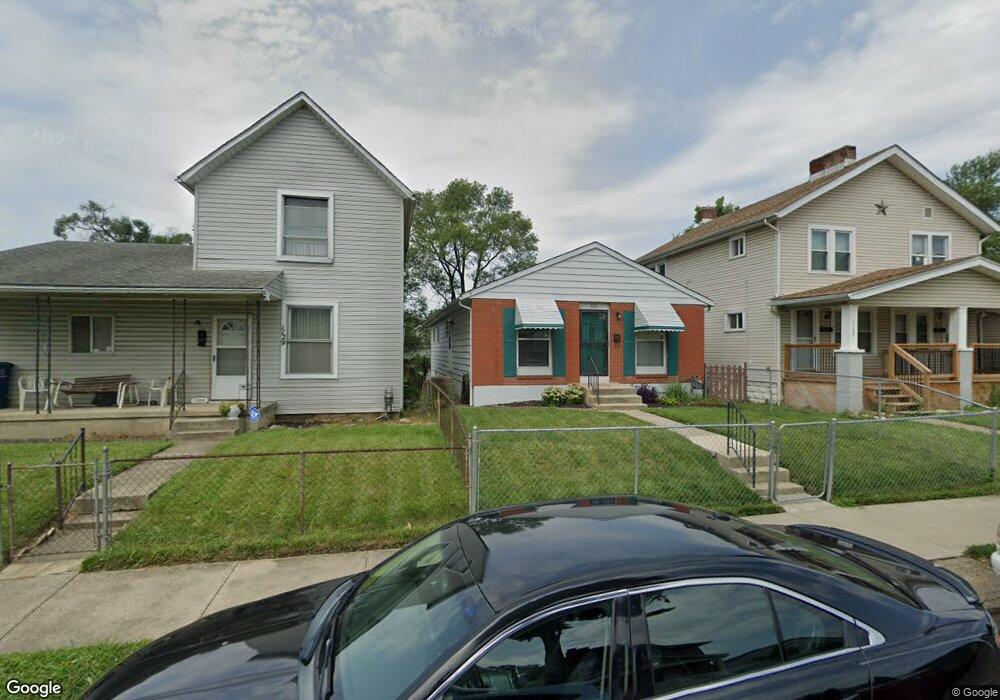
1133 Peters Ave Columbus, OH 43201
Milo-Grogan NeighborhoodEstimated Value: $136,000 - $159,000
2
Beds
1
Bath
1,200
Sq Ft
$120/Sq Ft
Est. Value
About This Home
This home is located at 1133 Peters Ave, Columbus, OH 43201 and is currently estimated at $144,355, approximately $120 per square foot. 1133 Peters Ave is a home located in Franklin County with nearby schools including Windsor Stem Acadmey, Linden-Mckinley Stem School On Arcadia, and Columbus Performance Academy.
Ownership History
Date
Name
Owned For
Owner Type
Purchase Details
Closed on
Jul 12, 2001
Sold by
Hall Charles C
Bought by
Booth Bertha M
Current Estimated Value
Home Financials for this Owner
Home Financials are based on the most recent Mortgage that was taken out on this home.
Original Mortgage
$59,033
Interest Rate
7.16%
Mortgage Type
FHA
Purchase Details
Closed on
Jul 1, 1998
Sold by
Hall Charles C
Bought by
Atwood Partnership I
Home Financials for this Owner
Home Financials are based on the most recent Mortgage that was taken out on this home.
Original Mortgage
$63,000
Interest Rate
7%
Mortgage Type
Seller Take Back
Purchase Details
Closed on
May 4, 1990
Bought by
Hall Charles C
Purchase Details
Closed on
Jun 1, 1988
Purchase Details
Closed on
Feb 23, 1988
Create a Home Valuation Report for This Property
The Home Valuation Report is an in-depth analysis detailing your home's value as well as a comparison with similar homes in the area
Home Values in the Area
Average Home Value in this Area
Purchase History
| Date | Buyer | Sale Price | Title Company |
|---|---|---|---|
| Booth Bertha M | $59,500 | Title First Agency Inc | |
| Atwood Partnership I | $94,500 | -- | |
| Hall Charles C | $56,600 | -- | |
| -- | -- | -- | |
| -- | -- | -- |
Source: Public Records
Mortgage History
| Date | Status | Borrower | Loan Amount |
|---|---|---|---|
| Previous Owner | Booth Bertha M | $59,033 | |
| Previous Owner | Atwood Partnership I | $63,000 |
Source: Public Records
Tax History Compared to Growth
Tax History
| Year | Tax Paid | Tax Assessment Tax Assessment Total Assessment is a certain percentage of the fair market value that is determined by local assessors to be the total taxable value of land and additions on the property. | Land | Improvement |
|---|---|---|---|---|
| 2024 | $1,652 | $36,820 | $5,110 | $31,710 |
| 2023 | $1,631 | $36,820 | $5,110 | $31,710 |
| 2022 | $886 | $17,080 | $2,100 | $14,980 |
| 2021 | $887 | $17,080 | $2,100 | $14,980 |
| 2020 | $889 | $17,080 | $2,100 | $14,980 |
| 2019 | $898 | $14,810 | $1,820 | $12,990 |
| 2018 | $906 | $14,320 | $1,820 | $12,500 |
| 2017 | $868 | $14,320 | $1,820 | $12,500 |
| 2016 | $1,041 | $15,720 | $2,070 | $13,650 |
| 2015 | $945 | $15,720 | $2,070 | $13,650 |
| 2014 | $948 | $15,720 | $2,070 | $13,650 |
| 2013 | $519 | $17,465 | $2,310 | $15,155 |
Source: Public Records
Map
Nearby Homes
- 1082-1084 Peters Ave
- 940 Shoemaker Ave
- 940-942 Leona Ave
- 1186 Saint Clair Ave
- 927 Camden Ave
- 923 Camden Ave
- 911 Camden Ave
- 1025 Howard St
- 997-999 Gibbard Ave
- 796 Gibbard Ave
- 780-782 Gibbard Ave
- 779 Gibbard Ave
- 810-812 E 3rd Ave
- 773-775 E 3rd Ave
- 0 Leona Ave
- 790-792 E Starr Ave
- 841 Saint Clair Ave
- 0 E 4th Ave
- 276 E 4th Ave
- 1471 Jefferson Ave
- 1137 Peters Ave Unit 139
- 1137-1139 Peters Ave
- 1129 Peters Ave
- 1141 Peters Ave
- 1121 Peters Ave
- 1145 Peters Ave
- 1149 Peters Ave
- 1119 Peters Ave
- 1142 Lexington Ave
- 1138 Lexington Ave
- 1146 Lexington Ave
- 1150 Lexington Ave
- 1134 Lexington Ave
- 1111 Peters Ave
- 1154 Lexington Ave
- 1132 Peters Ave
- 1130 Peters Ave
- 0 Peters Ave
- 1142 Peters Ave