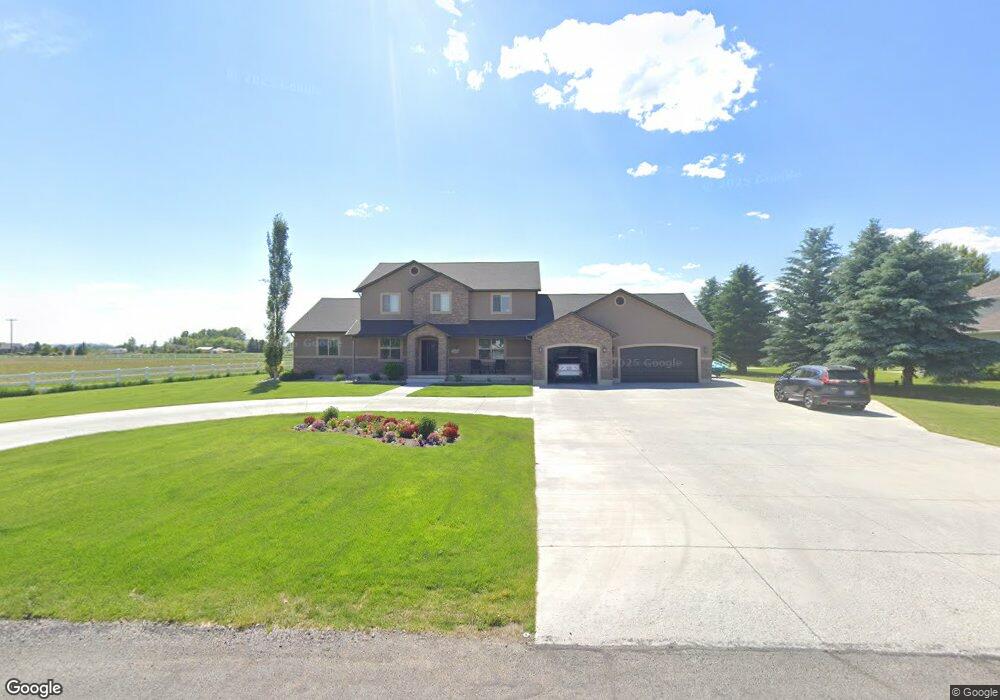
1133 Red Cedar Rd Rexburg, ID 83440
Estimated Value: $570,000 - $749,000
--
Bed
4
Baths
2,396
Sq Ft
$260/Sq Ft
Est. Value
About This Home
This home is located at 1133 Red Cedar Rd, Rexburg, ID 83440 and is currently estimated at $622,020, approximately $259 per square foot. 1133 Red Cedar Rd is a home with nearby schools including Hibbard Elementary School, Madison Junior High School, and Madison Senior High School.
Ownership History
Date
Name
Owned For
Owner Type
Purchase Details
Closed on
Feb 3, 2021
Sold by
Toone Matthew V and Toone Heather
Bought by
Laws Robert Dru and Laws Jessica May
Current Estimated Value
Home Financials for this Owner
Home Financials are based on the most recent Mortgage that was taken out on this home.
Original Mortgage
$400,000
Outstanding Balance
$357,135
Interest Rate
2.6%
Mortgage Type
New Conventional
Estimated Equity
$264,885
Purchase Details
Closed on
Jul 16, 2020
Sold by
Wray Dwight and Wray Jennifer
Bought by
Toone Matthew V
Home Financials for this Owner
Home Financials are based on the most recent Mortgage that was taken out on this home.
Original Mortgage
$449,825
Interest Rate
3.1%
Mortgage Type
New Conventional
Purchase Details
Closed on
May 7, 2013
Sold by
Hirschi Rick L and Hirschi Suzette
Bought by
Wray Dwight and Wray Jennifer
Create a Home Valuation Report for This Property
The Home Valuation Report is an in-depth analysis detailing your home's value as well as a comparison with similar homes in the area
Home Values in the Area
Average Home Value in this Area
Purchase History
| Date | Buyer | Sale Price | Title Company |
|---|---|---|---|
| Laws Robert Dru | -- | First American Title Rexburg | |
| Toone Matthew V | -- | First American Title | |
| Wray Dwight | -- | -- |
Source: Public Records
Mortgage History
| Date | Status | Borrower | Loan Amount |
|---|---|---|---|
| Open | Laws Robert Dru | $400,000 | |
| Previous Owner | Toone Matthew V | $449,825 |
Source: Public Records
Tax History Compared to Growth
Tax History
| Year | Tax Paid | Tax Assessment Tax Assessment Total Assessment is a certain percentage of the fair market value that is determined by local assessors to be the total taxable value of land and additions on the property. | Land | Improvement |
|---|---|---|---|---|
| 2025 | $3,015 | $561,118 | $80,000 | $481,118 |
| 2024 | $3,015 | $561,118 | $80,000 | $481,118 |
| 2023 | $3,015 | $535,472 | $70,000 | $465,472 |
| 2022 | $3,337 | $456,590 | $50,000 | $406,590 |
| 2021 | $3,191 | $391,623 | $35,000 | $356,623 |
| 2020 | $2,700 | $325,066 | $32,000 | $293,066 |
| 2019 | $2,737 | $296,818 | $32,000 | $264,818 |
| 2018 | $2,749 | $299,493 | $32,000 | $267,493 |
| 2017 | $2,561 | $281,661 | $32,000 | $249,661 |
| 2016 | $2,461 | $273,242 | $32,000 | $241,242 |
| 2015 | $462 | $265,289 | $0 | $0 |
| 2013 | -- | $32,000 | $0 | $0 |
Source: Public Records
Map
Nearby Homes
- TBD Lot3 3000 W
- TBD Lot4 3000 W
- TBD lot2 3000 W Unit Lot 2
- 1159 N 2582 W
- Vanbrough Plan at Copper Heights
- Stanton Plan at Copper Heights
- Edgeworth Plan at Copper Heights
- Xavier Plan at Copper Heights
- Canyon Plan at Copper Heights
- Ravenstone Plan at Copper Heights
- Westbrook Plan at Copper Heights
- 2713 Cyprus Ct
- 2602 Winter Dr
- 2534 Titan Dr
- 2560 Titan Dr
- 2358 Robinson Dr
- 2272 Robison Dr
- 1011 N 12th W
- TBD Clover Meadow Way
- 2561 Silverleaf Ln
- 1161 Red Cedar Rd
- 1144 Red Cedar Rd
- 1189 Red Cedar Rd
- 3510 W 1000 N
- 1182 Red Cedar Rd
- 1075 Crescent Dr
- 1221 Red Cedar Rd
- 1216 Red Cedar Rd
- 1177 Cresent Dr
- 3484 W 1000 N
- 1249 Red Cedar Rd
- 3424 W 1000 N
- 1252 Red Cedar Rd
- 3379 White Pine St
- 3376 W 1000 N
- 1277 Red Cedar Rd
- 3346 W 1000 N
- 987 N 3441 W
- 1251 Crescent Dr
- 1303 Red Cedar Rd