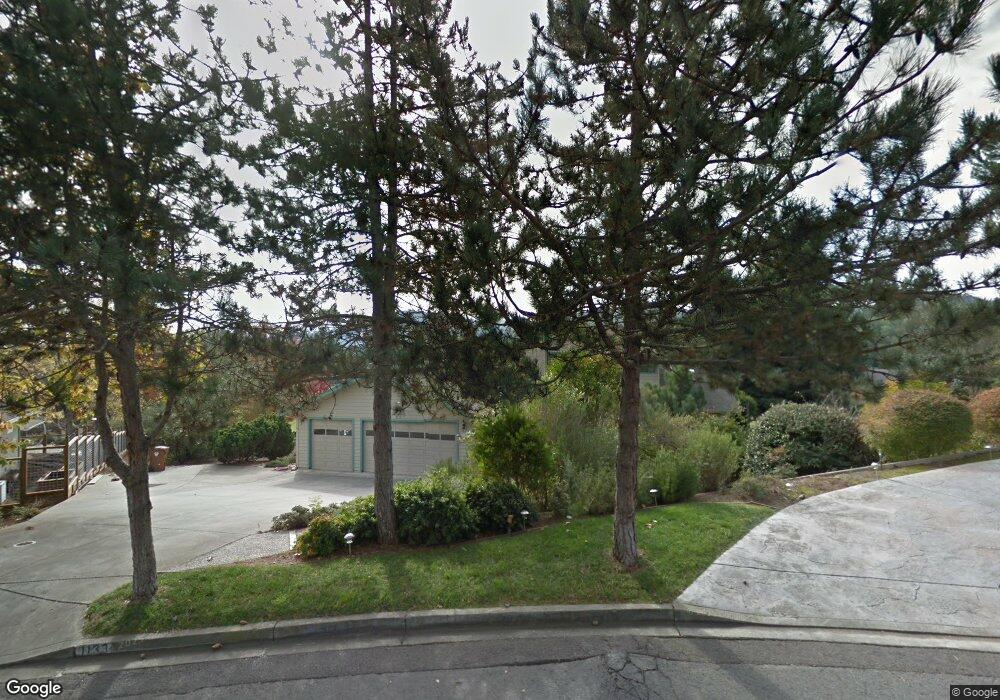
1133 Stanford Ct Napa, CA 94558
Browns Valley NeighborhoodEstimated Value: $1,325,000 - $1,599,000
3
Beds
3
Baths
2,658
Sq Ft
$546/Sq Ft
Est. Value
About This Home
This home is located at 1133 Stanford Ct, Napa, CA 94558 and is currently estimated at $1,450,049, approximately $545 per square foot. 1133 Stanford Ct is a home located in Napa County with nearby schools including Browns Valley Elementary School, Harvest Middle School, and Napa High School.
Ownership History
Date
Name
Owned For
Owner Type
Purchase Details
Closed on
Nov 5, 2024
Sold by
Steven T Nielsen Survivors Trust and Nielsen Steven T
Bought by
Nielsen Corey and Nielsen Faith
Current Estimated Value
Purchase Details
Closed on
Sep 12, 2023
Sold by
Steven T Nielsen Survivors Trust and Nielsen Steven T
Bought by
Davidon Homes
Purchase Details
Closed on
Apr 5, 2017
Sold by
Nielsen Steven T and The Steven T Nielsen & Barbara
Bought by
Nielsen Steven T and The Steven T Nielsen Survivors
Purchase Details
Closed on
Jun 17, 2010
Sold by
Nielsen Steven T and Nielsen Barbara A
Bought by
Nielsen Steven T and Nielsen Barbara A
Home Financials for this Owner
Home Financials are based on the most recent Mortgage that was taken out on this home.
Original Mortgage
$300,000
Interest Rate
4.12%
Mortgage Type
New Conventional
Purchase Details
Closed on
Jul 22, 2008
Sold by
Nielsen Steven T
Bought by
Nielsen Steven T and Nielsen Barbara A
Purchase Details
Closed on
Jun 28, 2005
Sold by
Nielsen Thomas M
Bought by
Nielsen Thomas M and The Thomas M Nielsen Revocable
Purchase Details
Closed on
Jun 9, 2005
Sold by
Nielsen Steven T and Nielsen Barbara A
Bought by
Nielsen Steven T and Nielsen Barbara A
Purchase Details
Closed on
Mar 4, 2004
Sold by
Nielsen Steven T
Bought by
Nielsen Steven T and Nielsen Barbara A
Home Financials for this Owner
Home Financials are based on the most recent Mortgage that was taken out on this home.
Original Mortgage
$328,800
Interest Rate
4.87%
Mortgage Type
Purchase Money Mortgage
Purchase Details
Closed on
Nov 4, 2002
Sold by
Nielsen Colleen G
Bought by
Nielsen Steven T
Home Financials for this Owner
Home Financials are based on the most recent Mortgage that was taken out on this home.
Original Mortgage
$330,000
Interest Rate
5.37%
Purchase Details
Closed on
Sep 18, 1998
Sold by
Nielsen Steven T and Nielsen Thomas M
Bought by
Nielsen Steven T and Nielsen Colleen G
Home Financials for this Owner
Home Financials are based on the most recent Mortgage that was taken out on this home.
Original Mortgage
$189,500
Interest Rate
6.89%
Purchase Details
Closed on
Sep 4, 1998
Sold by
Nielsen Colleen G
Bought by
Nielsen Steven T
Home Financials for this Owner
Home Financials are based on the most recent Mortgage that was taken out on this home.
Original Mortgage
$189,500
Interest Rate
6.89%
Purchase Details
Closed on
Apr 4, 1995
Sold by
Nielsen Steven T and Nielsen Colleen G
Bought by
Nielsen Steven T and Nielsen Colleen G
Create a Home Valuation Report for This Property
The Home Valuation Report is an in-depth analysis detailing your home's value as well as a comparison with similar homes in the area
Home Values in the Area
Average Home Value in this Area
Purchase History
| Date | Buyer | Sale Price | Title Company |
|---|---|---|---|
| Nielsen Corey | -- | None Listed On Document | |
| Nielsen Corey | -- | None Listed On Document | |
| Nielsen Corey | -- | None Listed On Document | |
| Davidon Homes | -- | First American Title | |
| Nielsen Steven T | -- | None Available | |
| Nielsen Steven T | -- | First American Title Co Napa | |
| Nielsen Steven T | -- | First American Title Co Napa | |
| Nielsen Steven T | -- | None Available | |
| Nielsen Steven T | -- | None Available | |
| Nielsen Thomas M | -- | -- | |
| Nielsen Steven T | -- | -- | |
| Nielsen Steven T | -- | -- | |
| Nielsen Steven T | -- | North American Title Co | |
| Nielsen Steven T | -- | North American Title Co | |
| Nielsen Steven T | -- | North American Title Co | |
| Nielsen Steven T | -- | North American Title Co | |
| Nielsen Steven T | -- | -- |
Source: Public Records
Mortgage History
| Date | Status | Borrower | Loan Amount |
|---|---|---|---|
| Previous Owner | Nielsen Steven T | $300,000 | |
| Previous Owner | Nielsen Steven T | $328,800 | |
| Previous Owner | Nielsen Steven T | $330,000 | |
| Previous Owner | Nielsen Steven T | $189,500 |
Source: Public Records
Tax History Compared to Growth
Tax History
| Year | Tax Paid | Tax Assessment Tax Assessment Total Assessment is a certain percentage of the fair market value that is determined by local assessors to be the total taxable value of land and additions on the property. | Land | Improvement |
|---|---|---|---|---|
| 2025 | $6,713 | $551,234 | $195,226 | $356,008 |
| 2024 | $6,713 | $540,427 | $191,399 | $349,028 |
| 2023 | $6,713 | $529,832 | $187,647 | $342,185 |
| 2022 | $6,515 | $519,444 | $183,968 | $335,476 |
| 2021 | $6,425 | $509,260 | $180,361 | $328,899 |
| 2020 | $6,379 | $504,039 | $178,512 | $325,527 |
| 2019 | $6,244 | $494,157 | $175,012 | $319,145 |
| 2018 | $6,155 | $484,469 | $171,581 | $312,888 |
| 2017 | $6,028 | $474,970 | $168,217 | $306,753 |
| 2016 | $5,900 | $465,658 | $164,919 | $300,739 |
| 2015 | $5,517 | $458,664 | $162,442 | $296,222 |
| 2014 | $5,432 | $449,680 | $159,260 | $290,420 |
Source: Public Records
Map
Nearby Homes
- 1152 Stanford Ct
- 1100 Borrette Ln
- 1080 Borrette Ln
- 1070 Borrette Ln
- Homesite Four Plan at Western Meadows
- Homesite Eight Plan at Western Meadows
- Homesite Six Plan at Western Meadows
- Homesite Three Plan at Western Meadows
- Homesite Two Plan at Western Meadows
- 1060 Borrette Ln
- 1015 Borrette Ct
- 1070 Borrette Ct
- 3051 Redwood Rd
- 18 Tuscany Ct
- 1015 Borrette Ln
- 115 Waterstone Ct
- 236 Skylark Way
- 3493 Westminster Way
- 17 Pomo Ct
- 2890 Redwood Rd
- 1145 Stanford Ct
- 1131 Stanford Ct
- 1127 Broadmoor Dr
- 1123 Broadmoor Dr
- 1144 Stanford Ct
- 1147 Stanford Ct
- 1119 Broadmoor Dr
- 1113 Broadmoor Dr
- 1126 Broadmoor Dr
- 1153 Stanford Ct
- 3696 Dartmouth Dr
- 1147 Broadmoor Dr
- 1142 Broadmoor Dr
- 1168 Stanford Ct
- 1130 Yale Ct
- 3688 Dartmouth Dr
- 1105 Broadmoor Dr
- 1167 Stanford Ct
- 1151 Broadmoor Dr
- 1138 Yale Ct