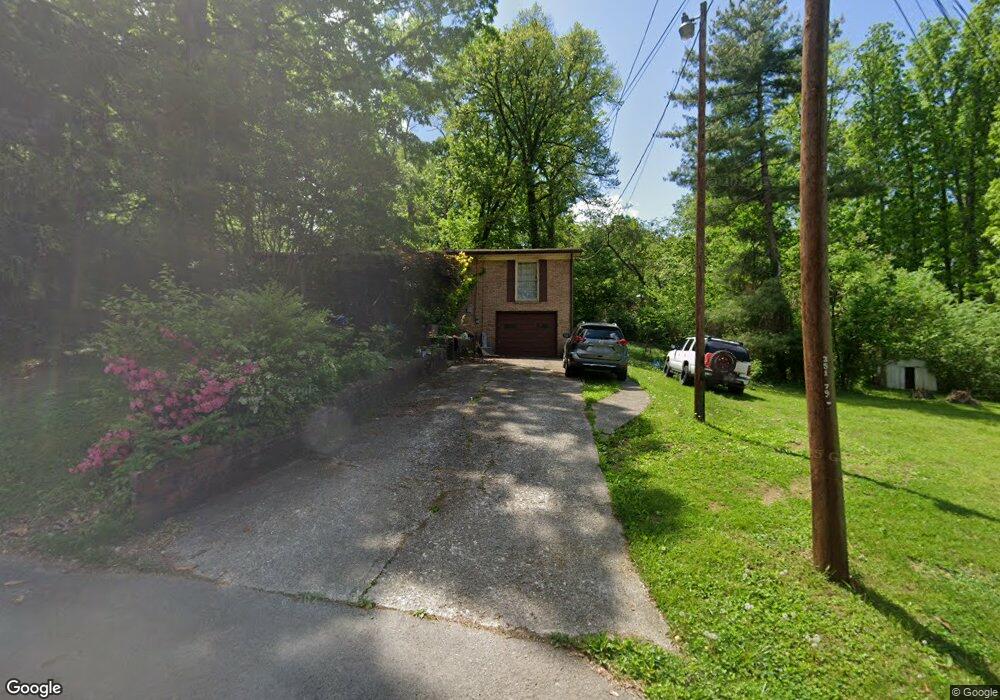
1133 Terrance Cir Talbott, TN 37877
Estimated Value: $253,000 - $330,000
3
Beds
2
Baths
1,539
Sq Ft
$192/Sq Ft
Est. Value
About This Home
This home is located at 1133 Terrance Cir, Talbott, TN 37877 and is currently estimated at $295,557, approximately $192 per square foot. 1133 Terrance Cir is a home located in Hamblen County with nearby schools including Alpha Elementary School, West View Middle School, and Morristown West High School.
Ownership History
Date
Name
Owned For
Owner Type
Purchase Details
Closed on
Oct 11, 2006
Sold by
Allen Harbin David
Bought by
Barbara Kholer
Current Estimated Value
Home Financials for this Owner
Home Financials are based on the most recent Mortgage that was taken out on this home.
Original Mortgage
$99,960
Outstanding Balance
$64,248
Interest Rate
7.9%
Estimated Equity
$231,309
Purchase Details
Closed on
Oct 6, 2006
Bought by
Kholer Barbara
Home Financials for this Owner
Home Financials are based on the most recent Mortgage that was taken out on this home.
Original Mortgage
$99,960
Outstanding Balance
$64,248
Interest Rate
7.9%
Estimated Equity
$231,309
Purchase Details
Closed on
Nov 5, 1990
Bought by
Harbin David Allen
Purchase Details
Closed on
Oct 1, 1984
Bought by
Bowlin Alfred Daniel and Lisa Byrd
Purchase Details
Closed on
Mar 14, 1978
Bought by
Snodderly Michael and Snodderly Patricia
Create a Home Valuation Report for This Property
The Home Valuation Report is an in-depth analysis detailing your home's value as well as a comparison with similar homes in the area
Home Values in the Area
Average Home Value in this Area
Purchase History
| Date | Buyer | Sale Price | Title Company |
|---|---|---|---|
| Barbara Kholer | $124,950 | -- | |
| Kholer Barbara | $125,000 | -- | |
| Harbin David Allen | $53,500 | -- | |
| Bowlin Alfred Daniel | $35,000 | -- | |
| Snodderly Michael | $37,900 | -- |
Source: Public Records
Mortgage History
| Date | Status | Borrower | Loan Amount |
|---|---|---|---|
| Open | Snodderly Michael | $99,960 | |
| Closed | Snodderly Michael | $24,990 | |
| Closed | Snodderly Michael | $99,960 |
Source: Public Records
Tax History Compared to Growth
Tax History
| Year | Tax Paid | Tax Assessment Tax Assessment Total Assessment is a certain percentage of the fair market value that is determined by local assessors to be the total taxable value of land and additions on the property. | Land | Improvement |
|---|---|---|---|---|
| 2024 | $693 | $35,200 | $5,275 | $29,925 |
| 2023 | $693 | $35,200 | $0 | $0 |
| 2022 | $693 | $35,200 | $5,275 | $29,925 |
| 2021 | $693 | $35,200 | $5,275 | $29,925 |
| 2020 | $693 | $35,200 | $5,275 | $29,925 |
| 2019 | $680 | $31,925 | $5,225 | $26,700 |
| 2018 | $680 | $31,925 | $5,225 | $26,700 |
| 2017 | $680 | $31,925 | $5,225 | $26,700 |
| 2016 | $635 | $31,925 | $5,225 | $26,700 |
| 2015 | $591 | $31,925 | $5,225 | $26,700 |
| 2014 | -- | $31,925 | $5,225 | $26,700 |
| 2013 | -- | $34,650 | $0 | $0 |
Source: Public Records
Map
Nearby Homes
- 663 Barbara Dr
- 818 Shaver Dr
- 502 Barbara Dr
- 623 Whippoorwill Dr
- 680 Ronald Dr
- 7242 Cherrybrook Ln
- 633 Shaver Dr
- 7037 Maxwell Terrace
- 1167 Cherry Blossom Ln
- 7350 W Andrew Johnson Hwy
- 514 Phyllis Cir
- 8 Talbott-Kansas Rd
- 7 Talbott-Kansas Rd
- 6 Talbott-Kansas Rd
- 2559 Dogwood Ln
- 1067 Evan Ct
- Lot 50 Vista Dr
- Lot 49 Vista Dr
- Lot 48 Vista Dr
- Lot 47 Vista Dr
- 1105 Terrance Cir
- 1141 Terrance Cir
- 1148 Terrance Cir
- 1147 Terrance Cir
- 1116 Terrance Cir
- 1095 Woodwind Dr
- 740 Greenbriar Rd
- 800 Greenbriar Rd
- 732 Greenbriar Rd
- 1153 Terrance Cir
- 1100 Woodwind Dr
- 1085 Woodwind Dr
- 1130 Woodwind Dr
- TBD Greenbriar Rd
- 00 Greenbriar Rd
- 0 Greenbriar Rd Unit 603672
- 0 Greenbriar Rd Unit 1170705
- 0 Greenbriar Rd Unit 587908
- 1090 Woodwind Dr
- 724 Greenbriar Rd