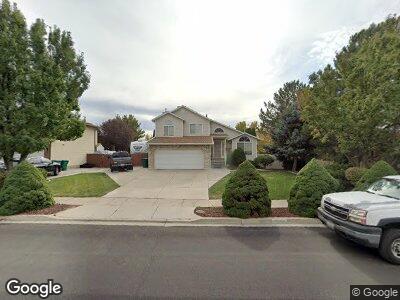
1133 W 25 S Clearfield, UT 84015
Estimated Value: $464,000 - $500,000
3
Beds
3
Baths
2,600
Sq Ft
$187/Sq Ft
Est. Value
About This Home
This home is located at 1133 W 25 S, Clearfield, UT 84015 and is currently estimated at $486,572, approximately $187 per square foot. 1133 W 25 S is a home located in Davis County with nearby schools including Holt Elementary School, North Davis Junior High School, and Syracuse High School.
Ownership History
Date
Name
Owned For
Owner Type
Purchase Details
Closed on
Nov 23, 2010
Sold by
Palmer Terry and Palmer Annette
Bought by
Palmer Terry L and Palmer Annette N
Current Estimated Value
Home Financials for this Owner
Home Financials are based on the most recent Mortgage that was taken out on this home.
Original Mortgage
$98,000
Interest Rate
4.16%
Mortgage Type
New Conventional
Purchase Details
Closed on
Nov 15, 2002
Sold by
Johnston Michael William and Johnston Cheryl L
Bought by
Palmer Terry and Palmer Annette
Home Financials for this Owner
Home Financials are based on the most recent Mortgage that was taken out on this home.
Original Mortgage
$141,184
Interest Rate
5.95%
Mortgage Type
FHA
Purchase Details
Closed on
Sep 27, 1996
Sold by
Yick Arthur J and Yick Shirley
Bought by
Johnston Michael William and Johnston Cheryl L
Home Financials for this Owner
Home Financials are based on the most recent Mortgage that was taken out on this home.
Original Mortgage
$127,070
Interest Rate
7.87%
Mortgage Type
FHA
Create a Home Valuation Report for This Property
The Home Valuation Report is an in-depth analysis detailing your home's value as well as a comparison with similar homes in the area
Home Values in the Area
Average Home Value in this Area
Purchase History
| Date | Buyer | Sale Price | Title Company |
|---|---|---|---|
| Palmer Terry L | -- | Equity Title Ins Agency Inc | |
| Palmer Terry | -- | Equity Title Agency | |
| Johnston Michael William | -- | Bonneville Title Company Inc | |
| Johnston Michael William | -- | Bonneville Title Company Inc |
Source: Public Records
Mortgage History
| Date | Status | Borrower | Loan Amount |
|---|---|---|---|
| Closed | Palmer Terry L | $98,000 | |
| Closed | Palmer Terry | $141,184 | |
| Previous Owner | Johnston Michael William | $127,070 |
Source: Public Records
Tax History Compared to Growth
Tax History
| Year | Tax Paid | Tax Assessment Tax Assessment Total Assessment is a certain percentage of the fair market value that is determined by local assessors to be the total taxable value of land and additions on the property. | Land | Improvement |
|---|---|---|---|---|
| 2024 | $2,474 | $223,300 | $73,264 | $150,036 |
| 2023 | $2,281 | $378,000 | $116,798 | $261,202 |
| 2022 | $2,443 | $218,900 | $66,466 | $152,434 |
| 2021 | $2,127 | $288,000 | $72,922 | $215,078 |
| 2020 | $1,844 | $248,000 | $61,753 | $186,247 |
| 2019 | $1,786 | $237,000 | $63,159 | $173,841 |
| 2018 | $1,593 | $206,000 | $56,060 | $149,940 |
| 2016 | $1,493 | $100,925 | $22,543 | $78,382 |
| 2015 | $1,299 | $83,765 | $22,543 | $61,222 |
| 2014 | $1,250 | $81,685 | $22,543 | $59,142 |
| 2013 | -- | $87,683 | $31,680 | $56,003 |
Source: Public Records
Map
Nearby Homes
- 81 S 1300 W
- 60 N 1000 W
- 81 N 950 W
- 1112 W 250 N
- 168 N 825 W Unit 8
- 194 N 825 W Unit 7
- 208 N 825 W Unit 6
- 1212 W 400 N Unit 92
- 1421 W 400 S
- 92 1219 W 450 N
- 1124 W 450 N Unit 18
- 1350 W 300 N Unit 9
- 1350 W 300 N Unit 38
- 1350 W 300 N Unit 49
- 1456 W 550 S
- 1304 W 500 N Unit 166
- 1337 W 550 N Unit 195
- 570 N 1100 W
- 3943 W 1800 N
- 72 S 525 W