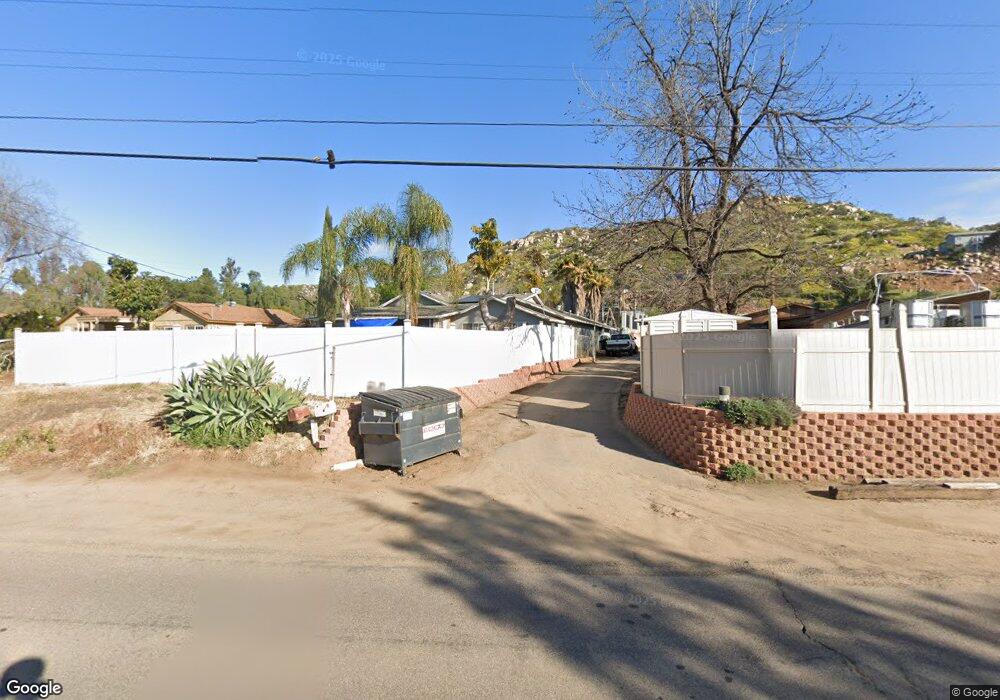
11330 El Nopal Lakeside, CA 92040
Estimated Value: $615,000 - $768,810
3
Beds
1
Bath
1,090
Sq Ft
$647/Sq Ft
Est. Value
About This Home
This home is located at 11330 El Nopal, Lakeside, CA 92040 and is currently estimated at $704,703, approximately $646 per square foot. 11330 El Nopal is a home located in San Diego County with nearby schools including Lakeside Farms Elementary School, Lakeside Middle School, and Santana High School.
Ownership History
Date
Name
Owned For
Owner Type
Purchase Details
Closed on
Oct 21, 2015
Sold by
Morris David C and Morris Misti L
Bought by
Morris Ii David C and Morris Misti L
Current Estimated Value
Home Financials for this Owner
Home Financials are based on the most recent Mortgage that was taken out on this home.
Original Mortgage
$349,500
Outstanding Balance
$209,347
Interest Rate
3.85%
Mortgage Type
New Conventional
Estimated Equity
$495,356
Purchase Details
Closed on
Mar 7, 1997
Sold by
Home Svgs Of America Fsb
Bought by
Morris David and Morris Misti L
Home Financials for this Owner
Home Financials are based on the most recent Mortgage that was taken out on this home.
Original Mortgage
$128,988
Interest Rate
7.74%
Mortgage Type
FHA
Purchase Details
Closed on
Oct 7, 1996
Sold by
Jesse Hernandez
Bought by
Home Svgs Of America Fsb
Purchase Details
Closed on
May 31, 1988
Purchase Details
Closed on
Mar 18, 1983
Create a Home Valuation Report for This Property
The Home Valuation Report is an in-depth analysis detailing your home's value as well as a comparison with similar homes in the area
Purchase History
We collect this data history from publicly available records. To have your information removed, we recommend requesting removal directly through your county’s website.
| Date | Buyer | Sale Price | Title Company |
|---|---|---|---|
| Morris Ii David C | -- | Corinthian Title Company | |
| Morris David | $131,000 | First Southwestern Title Co | |
| Home Svgs Of America Fsb | $122,400 | Stewart Title | |
| -- | $95,500 | -- | |
| -- | $90,000 | -- |
Source: Public Records
Mortgage History
We collect this data history from publicly available records. To have your information removed, we recommend requesting removal directly through your county’s website.
| Date | Status | Borrower | Loan Amount |
|---|---|---|---|
| Open | Morris Ii David C | $349,500 | |
| Closed | Morris David | $128,988 |
Source: Public Records
Tax History
| Year | Tax Paid | Tax Assessment Tax Assessment Total Assessment is a certain percentage of the fair market value that is determined by local assessors to be the total taxable value of land and additions on the property. | Land | Improvement |
|---|---|---|---|---|
| 2025 | $2,562 | $213,331 | $97,706 | $115,625 |
| 2024 | $2,562 | $209,149 | $95,791 | $113,358 |
| 2023 | $2,470 | $205,049 | $93,913 | $111,136 |
| 2022 | $2,428 | $201,029 | $92,072 | $108,957 |
| 2021 | $2,389 | $197,088 | $90,267 | $106,821 |
| 2020 | $2,361 | $195,068 | $89,342 | $105,726 |
| 2019 | $2,317 | $191,244 | $87,591 | $103,653 |
| 2018 | $2,288 | $187,495 | $85,874 | $101,621 |
| 2017 | $820 | $183,820 | $84,191 | $99,629 |
| 2016 | $2,190 | $180,217 | $82,541 | $97,676 |
| 2015 | $2,177 | $177,511 | $81,302 | $96,209 |
| 2014 | $2,069 | $174,035 | $79,710 | $94,325 |
Source: Public Records
Map
Nearby Homes
- 11320 El Nopal Unit 5619
- 10252 Riverhill Ln
- 10161 Riverhill Ln
- 11436 El Nopal
- 11457 El Nopal
- 10658 Shady Meadow Loop
- 10253 Paseo Park Dr
- 10240 Caminito Rio Ct
- 10252 Santana St
- 10812 2nd St
- 11529 Woodside Ave
- 10738 2nd St
- 9715 Kenesaw Ct
- 10828 Len St
- 9947 Cleary St
- 10459 Santana St
- 10704 El Nopal
- 11851 Riverside Dr Unit 276
- 11851 Riverside Dr Unit Spc 225
- 11851 Riverside Dr Unit 206
- 11342 El Nopal
- 11326 El Nopal
- 11338 El Nopal Unit 12
- 11320 El Nopal Unit 1
- 11320 El Nopal
- 11218 Big Cone Dr
- 11210 Big Cone Dr
- 11236 Big Cone Dr
- 11202 Big Cone Dr
- 11244 Big Cone Dr
- 11354 El Nopal
- 11252 Big Cone Dr
- 11260 Big Cone Dr
- 11348 El Nopal
- 10290 Pinery Grove
- 11225 Big Cone Dr
- 11278 El Nopal
- 11374 El Nopal
- 11237 Big Cone Dr
- 11268 Big Cone Dr
Your Personal Tour Guide
Ask me questions while you tour the home.