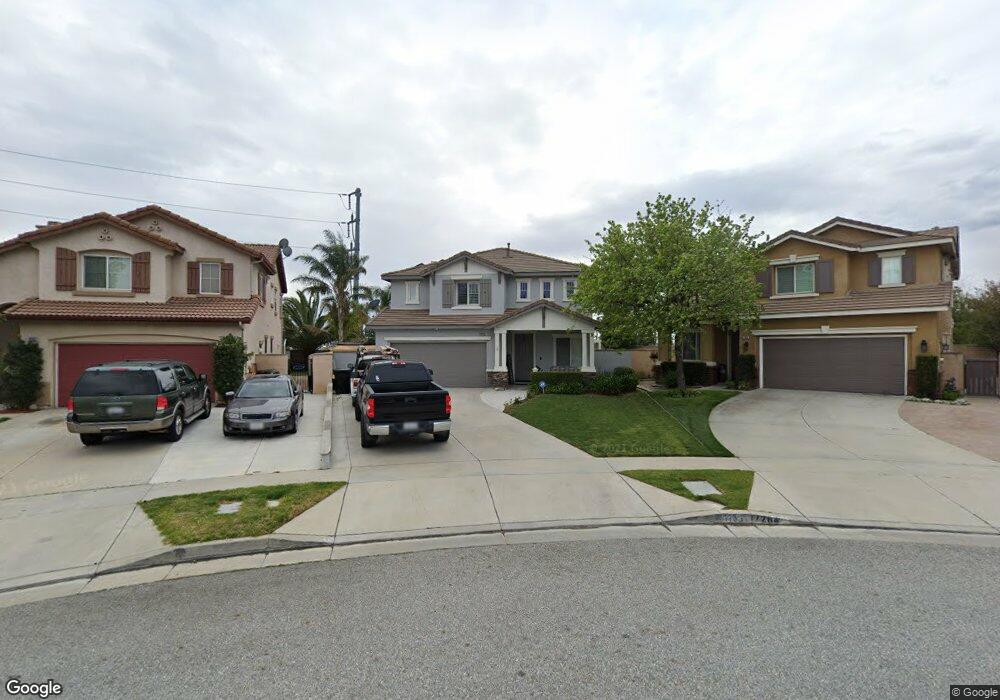
11331 Broken Branch Dr Rancho Cucamonga, CA 91701
Victoria NeighborhoodEstimated Value: $913,000 - $1,042,000
5
Beds
3
Baths
2,584
Sq Ft
$382/Sq Ft
Est. Value
About This Home
This home is located at 11331 Broken Branch Dr, Rancho Cucamonga, CA 91701 and is currently estimated at $988,005, approximately $382 per square foot. 11331 Broken Branch Dr is a home located in San Bernardino County with nearby schools including Carleton P. Lightfoot Elementary, Day Creek Intermediate, and Rancho Cucamonga High School.
Ownership History
Date
Name
Owned For
Owner Type
Purchase Details
Closed on
Jul 19, 2023
Sold by
Garcia Cesar and Garcia Reina
Bought by
Garcia Family Trust and Garcia
Current Estimated Value
Purchase Details
Closed on
Sep 22, 2016
Sold by
Garcia Reina M
Bought by
Garcia Cesar and Garcia Reina
Home Financials for this Owner
Home Financials are based on the most recent Mortgage that was taken out on this home.
Original Mortgage
$362,000
Interest Rate
3.43%
Mortgage Type
New Conventional
Purchase Details
Closed on
Aug 16, 2016
Sold by
Garcia Reina M and Contreras Reina M
Bought by
Garcia Reina M
Home Financials for this Owner
Home Financials are based on the most recent Mortgage that was taken out on this home.
Original Mortgage
$362,000
Interest Rate
3.43%
Mortgage Type
New Conventional
Purchase Details
Closed on
May 20, 2014
Sold by
Contreras Reina M
Bought by
Contreras Reina M
Home Financials for this Owner
Home Financials are based on the most recent Mortgage that was taken out on this home.
Original Mortgage
$377,000
Interest Rate
4.27%
Mortgage Type
New Conventional
Purchase Details
Closed on
Jan 11, 2013
Sold by
Loera Eberto
Bought by
Contreras Reina M
Home Financials for this Owner
Home Financials are based on the most recent Mortgage that was taken out on this home.
Original Mortgage
$382,936
Interest Rate
3.37%
Mortgage Type
FHA
Purchase Details
Closed on
Jun 3, 2009
Sold by
Mckinley Stefanie
Bought by
Loera Eberto
Home Financials for this Owner
Home Financials are based on the most recent Mortgage that was taken out on this home.
Original Mortgage
$392,755
Interest Rate
4.83%
Mortgage Type
FHA
Purchase Details
Closed on
Sep 19, 2006
Sold by
Mckinley Stefanie M
Bought by
Mckinley Stefanie M and Davis Christopher
Purchase Details
Closed on
Nov 5, 2005
Sold by
Tang Hao
Bought by
Mckinley Stephanie M
Home Financials for this Owner
Home Financials are based on the most recent Mortgage that was taken out on this home.
Original Mortgage
$535,200
Interest Rate
6.2%
Mortgage Type
Fannie Mae Freddie Mac
Purchase Details
Closed on
Aug 1, 2002
Sold by
Dpdg Fund Iii Llc
Bought by
Tang Hao
Home Financials for this Owner
Home Financials are based on the most recent Mortgage that was taken out on this home.
Original Mortgage
$265,520
Interest Rate
6.06%
Create a Home Valuation Report for This Property
The Home Valuation Report is an in-depth analysis detailing your home's value as well as a comparison with similar homes in the area
Home Values in the Area
Average Home Value in this Area
Purchase History
| Date | Buyer | Sale Price | Title Company |
|---|---|---|---|
| Garcia Family Trust | -- | None Listed On Document | |
| Garcia Cesar | -- | Accommodation | |
| Garcia Reina M | -- | Fidelity National Title | |
| Contreras Reina M | -- | Chicago Title Company | |
| Contreras Reina M | -- | Chicago Title Company | |
| Contreras Reina M | $390,000 | Fidelity National Title | |
| Loera Eberto | $400,000 | North American Title Company | |
| Mckinley Stefanie | -- | North American Title Company | |
| Mckinley Stefanie M | -- | None Available | |
| Mckinley Stephanie M | $669,000 | Alliance Title San Diego | |
| Tang Hao | $332,000 | Fidelity |
Source: Public Records
Mortgage History
| Date | Status | Borrower | Loan Amount |
|---|---|---|---|
| Previous Owner | Garcia Reina M | $362,000 | |
| Previous Owner | Contreras Reina M | $377,000 | |
| Previous Owner | Contreras Reina M | $382,936 | |
| Previous Owner | Loera Eberto | $392,755 | |
| Previous Owner | Mckinley Stephanie M | $66,900 | |
| Previous Owner | Mckinley Stephanie M | $535,200 | |
| Previous Owner | Tang Hao | $265,520 |
Source: Public Records
Tax History
| Year | Tax Paid | Tax Assessment Tax Assessment Total Assessment is a certain percentage of the fair market value that is determined by local assessors to be the total taxable value of land and additions on the property. | Land | Improvement |
|---|---|---|---|---|
| 2025 | $6,782 | $480,255 | $120,063 | $360,192 |
| 2024 | $6,613 | $470,838 | $117,709 | $353,129 |
| 2023 | $6,457 | $461,606 | $115,401 | $346,205 |
| 2022 | $6,369 | $452,555 | $113,138 | $339,417 |
| 2021 | $6,270 | $443,682 | $110,920 | $332,762 |
| 2020 | $6,205 | $439,133 | $109,783 | $329,350 |
| 2019 | $6,071 | $430,522 | $107,630 | $322,892 |
| 2018 | $6,061 | $422,081 | $105,520 | $316,561 |
| 2017 | $5,829 | $413,805 | $103,451 | $310,354 |
| 2016 | $5,690 | $405,692 | $101,423 | $304,269 |
| 2015 | $5,649 | $399,599 | $99,900 | $299,699 |
| 2014 | $5,524 | $391,771 | $97,943 | $293,828 |
Source: Public Records
Map
Nearby Homes
- 7331 Belpine Place Unit 31
- 7353 Ellena W Unit 70
- 7353 Ellena W Unit 64
- 7353 Ellena W Unit 83
- 7353 Ellena W
- 11214 Terra Vista Pkwy Unit 54
- 11213 Terra Vista Pkwy Unit D
- 11261 Terra Vista Pkwy
- 11159 Saint Tropez Dr
- 7545 Calais Ct
- 11320 Genova Rd
- 7523 Wellington Place
- 7359 Stonebrook Place
- 11259 Drake St
- 11356 Verona Dr
- 10950 Glenoaks Dr
- 7343 Legacy Place
- 7004 Beal Ct
- 7358 Freedom Place
- 11708 Parliament Dr
- 11335 Broken Branch Dr
- 7264 Turning Leaf Place
- 11341 Broken Branch Dr
- 7262 Turning Leaf Place
- 11347 Broken Branch Dr
- 7255 Turning Leaf Place
- 7246 Turning Leaf Place
- 11357 Broken Branch Dr
- 7251 Turning Leaf Place
- 11361 Broken Branch Dr
- 7236 Turning Leaf Place
- 11356 Broken Branch Dr
- 11364 Broken Branch Dr
- 11371 Broken Branch Dr
- 7232 Turning Leaf Place
- 7235 Turning Leaf Place
- 11370 Broken Branch Dr
- 7234 Ravenswood Place
- 11377 Broken Branch Dr
Your Personal Tour Guide
Ask me questions while you tour the home.