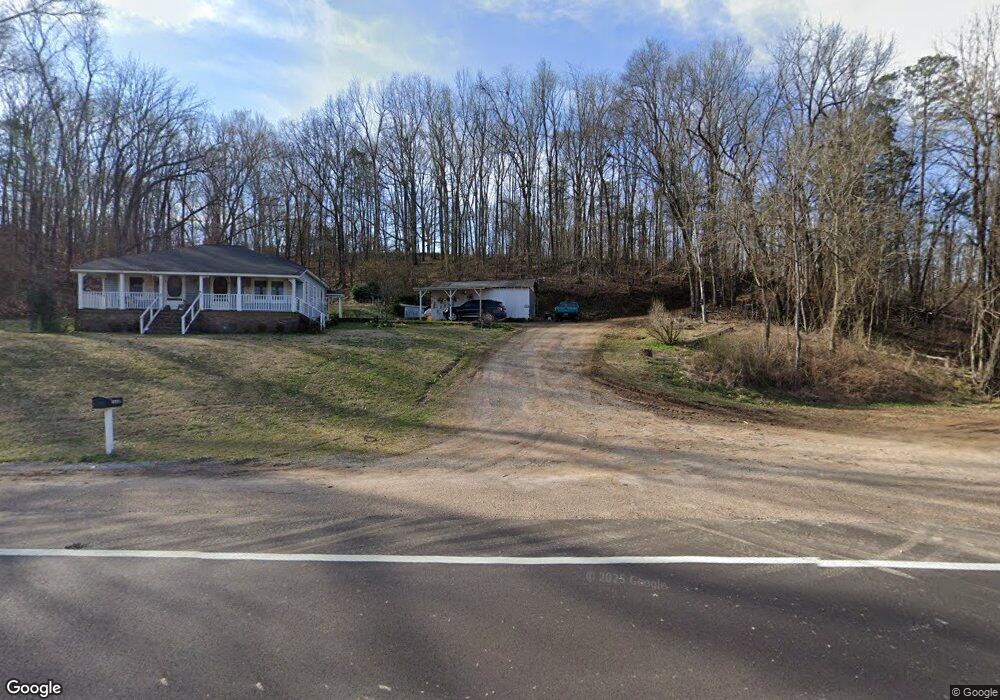
11335 Highway 69 Savannah, TN 38372
Estimated Value: $129,787 - $206,000
--
Bed
1
Bath
1,216
Sq Ft
$137/Sq Ft
Est. Value
About This Home
This home is located at 11335 Highway 69, Savannah, TN 38372 and is currently estimated at $166,947, approximately $137 per square foot. 11335 Highway 69 is a home located in Hardin County with nearby schools including Hardin County High School.
Ownership History
Date
Name
Owned For
Owner Type
Purchase Details
Closed on
Sep 17, 1999
Sold by
Franks Sheila M
Bought by
Fred Streff
Current Estimated Value
Home Financials for this Owner
Home Financials are based on the most recent Mortgage that was taken out on this home.
Original Mortgage
$37,131
Interest Rate
7.89%
Purchase Details
Closed on
Jan 23, 1997
Sold by
Glen Alexander Kenneth
Bought by
Sheila Franks
Purchase Details
Closed on
Jul 31, 1992
Bought by
Alexander Kenneth Glen and Marty Mari
Purchase Details
Closed on
Jul 12, 1991
Bought by
Hatfield Eddie Jane
Purchase Details
Closed on
Jan 24, 1989
Bought by
Hatfield David and Hatfield Linda
Purchase Details
Closed on
Sep 29, 1987
Bought by
Brown Randal E and Brown Evon
Purchase Details
Closed on
Jul 31, 1987
Bought by
Brown Randal E and Brown Evon
Purchase Details
Closed on
Jan 29, 1987
Bought by
Smith T J Real Est Inc
Purchase Details
Closed on
Oct 1, 1984
Bought by
Davis James and Davis Vinson H
Purchase Details
Closed on
Aug 12, 1983
Create a Home Valuation Report for This Property
The Home Valuation Report is an in-depth analysis detailing your home's value as well as a comparison with similar homes in the area
Home Values in the Area
Average Home Value in this Area
Purchase History
| Date | Buyer | Sale Price | Title Company |
|---|---|---|---|
| Fred Streff | $47,000 | -- | |
| Sheila Franks | $39,000 | -- | |
| Alexander Kenneth Glen | $29,000 | -- | |
| Hatfield Eddie Jane | $20,000 | -- | |
| Hatfield David | -- | -- | |
| Brown Randal E | -- | -- | |
| Brown Randal E | -- | -- | |
| Smith T J Real Est Inc | -- | -- | |
| Davis James | -- | -- | |
| -- | -- | -- |
Source: Public Records
Mortgage History
| Date | Status | Borrower | Loan Amount |
|---|---|---|---|
| Closed | Not Available | $37,131 |
Source: Public Records
Tax History Compared to Growth
Tax History
| Year | Tax Paid | Tax Assessment Tax Assessment Total Assessment is a certain percentage of the fair market value that is determined by local assessors to be the total taxable value of land and additions on the property. | Land | Improvement |
|---|---|---|---|---|
| 2024 | $484 | $27,675 | $11,000 | $16,675 |
| 2023 | $484 | $27,675 | $11,000 | $16,675 |
| 2022 | $428 | $20,775 | $9,050 | $11,725 |
| 2021 | $369 | $20,775 | $9,050 | $11,725 |
| 2020 | $369 | $17,925 | $9,050 | $8,875 |
| 2019 | $369 | $17,925 | $9,050 | $8,875 |
| 2018 | $357 | $17,925 | $9,050 | $8,875 |
| 2017 | $335 | $16,125 | $8,200 | $7,925 |
| 2016 | $335 | $16,125 | $8,200 | $7,925 |
| 2015 | $293 | $16,125 | $8,200 | $7,925 |
| 2014 | $293 | $16,125 | $8,200 | $7,925 |
Source: Public Records
Map
Nearby Homes
- 0 Bruton Branch Rd Unit 10140169
- 535 Megan Ln
- 410 Megan Ln
- 0061 Joanne Loop
- 0060 Joanne Loop
- 0059 Joanne Loop
- 0058 Joanne Loop
- 1 Lakeway Ln
- 0 Pompeys Branch Rd Unit 10177943
- 1 Bruton Rd
- 1405 Bruton Branch Rd
- 24 Bruton Branch Rd
- 0 Fox Ln
- 2125 Bruton Branch Rd
- 29 Choate Creek Rd
- 00 Fox Ln
- LOT 296 Tuscany Point
- 0 Preserve Blvd Unit 24433230
- 94 Preserve Blvd
- LOT 274 & 275 Secluded Loop
- 11445 Highway 69
- 11445 Highway 69
- 11195 Highway 69
- 11460 Highway 69
- 11155 Hyw 69 Hwy S
- 10955 Highway 69
- 0 Porter Ln Unit 3250734
- 0 Three Wheeler Dr
- 10850 Highway 69
- 0 3 Wheeler Dr Unit 3265217
- 1 3 Wheeler Dr
- 1146069 69 Hwy
- 11555 Highway 69
- 11500 Tn-69
- 1 Highway 69
- 355 Holland Creek Rd
- 340 Holland Creek Rd
- 10375 Highway 69
- 100 Three Wheeler Dr