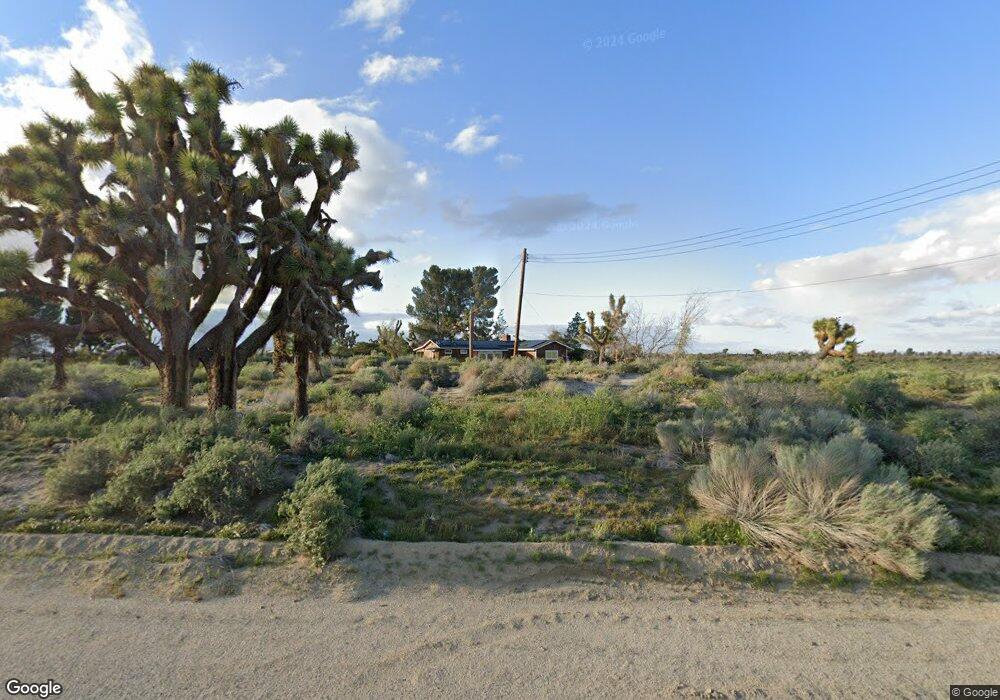
11337 E Avenue E Lancaster, CA 93535
Estimated Value: $514,000 - $555,547
2
Beds
2
Baths
1,645
Sq Ft
$330/Sq Ft
Est. Value
About This Home
This home is located at 11337 E Avenue E, Lancaster, CA 93535 and is currently estimated at $543,637, approximately $330 per square foot. 11337 E Avenue E is a home located in Los Angeles County with nearby schools including Eastside Elementary School, Gifford C. Cole Middle School, and Eastside High School.
Ownership History
Date
Name
Owned For
Owner Type
Purchase Details
Closed on
Dec 7, 2020
Sold by
Vander Eyk Cornelis and Vander Van Der
Bought by
Petersen Joel
Current Estimated Value
Home Financials for this Owner
Home Financials are based on the most recent Mortgage that was taken out on this home.
Original Mortgage
$388,550
Outstanding Balance
$344,328
Interest Rate
2.7%
Mortgage Type
New Conventional
Estimated Equity
$199,309
Purchase Details
Closed on
Oct 31, 2018
Sold by
Jakobsen Jorgen D and The Jorgen Jakobsen 2016 Revoc
Bought by
Cornelis Vander Eyk and Cornelis Van Der
Purchase Details
Closed on
Dec 19, 2016
Sold by
Jakobsen Jorgen D
Bought by
Jakobsen Jorgen D and Jorgen Jakobsen 2016 Revocable Trust
Purchase Details
Closed on
Sep 10, 2005
Sold by
Schilling Lawrence J and Schilling Mary P
Bought by
Jakobsen Jorgen D
Create a Home Valuation Report for This Property
The Home Valuation Report is an in-depth analysis detailing your home's value as well as a comparison with similar homes in the area
Purchase History
| Date | Buyer | Sale Price | Title Company |
|---|---|---|---|
| Petersen Joel | $485,000 | Fidelity Natl Ttl Lancaster | |
| Cornelis Vander Eyk | $50,000 | Chicago Title | |
| Jakobsen Jorgen D | -- | None Available | |
| Jakobsen Jorgen D | $245,000 | Chicago Title Co |
Source: Public Records
Mortgage History
| Date | Status | Borrower | Loan Amount |
|---|---|---|---|
| Open | Petersen Joel | $388,550 |
Source: Public Records
Tax History
| Year | Tax Paid | Tax Assessment Tax Assessment Total Assessment is a certain percentage of the fair market value that is determined by local assessors to be the total taxable value of land and additions on the property. | Land | Improvement |
|---|---|---|---|---|
| 2025 | $6,681 | $561,816 | $166,464 | $395,352 |
| 2024 | $6,681 | $550,800 | $163,200 | $387,600 |
| 2023 | $6,432 | $540,000 | $160,000 | $380,000 |
| 2022 | $5,222 | $423,300 | $126,990 | $296,310 |
| 2021 | $5,216 | $415,000 | $124,500 | $290,500 |
| 2020 | $3,021 | $234,600 | $45,900 | $188,700 |
| 2019 | $2,992 | $230,000 | $45,000 | $185,000 |
| 2018 | $2,535 | $196,500 | $76,700 | $119,800 |
| 2016 | $1,951 | $152,000 | $59,400 | $92,600 |
| 2015 | $1,946 | $152,000 | $59,400 | $92,600 |
| 2014 | $1,481 | $107,400 | $42,000 | $65,400 |
Source: Public Records
Map
Nearby Homes
- 0 Ave E & 107 St E Unit SR25117267
- 0 Ave E & 107 St E Unit 25004050
- 0 Vic Avenue D-10 Unit 24002129
- 49019 120th St E
- 215 Avenue D-2
- 0 E 110 E Avenue F12 # Vic Unit 25007810
- 107th Street East & Avenue D 4
- 0 E Ave E Vic 105 Ste
- 0 120th St E Unit 25008318
- 47660 E 120th St St E
- 0 E Ave D 123rd St E Unit 25002668
- 0 107th Street East & Ave D4 Unit 24006795
- 0 130th St E Unit IV26019675
- 0 130th St E Unit 26000718
- 0 119th St E and Ave F8 Vic Unit 26000024
- 0 132nd St E
- 13200 E Avenue E-10
- 0 Vac 95 Ste Vic Avenue D-8
- 47660 120th St E
- 120 E Avenue D
- 11337 E Avenue E
- 11317 E Avenue E
- 0 115th St East and Ave E Unit 24008489
- 0 E Ave Vic 116 Ste
- 0 E Vac Cor Avenue Pav 111 Unit 1205941
- 112 Th. Str. E Ave E
- 0 E Avenue e4 Unit 22009578
- 0 E Vac Cor Avenue Pav 110
- 0 Vic Avenue E6 116 Ste St Unit 22008255
- 48731 120th St E
- 0 E Vac Vic Avenue D8 116 Ste
- 48737 120th St E
- 0 112th East & Ave D-7 Ave
- 0 110th St East & Ave D-8 Unit 534317
- 48801 120th St E
- 48825 120th St E
- 0 Vac 110 Ste Vic Avenue D-4
- 0 Ave E & 107 St E Unit CRSR25117267
- 0 Avenue E and 107th St E Unit 21005058
- 0 E Vac Ave D-2 Vic 92 Ste Unit 15009344
Your Personal Tour Guide
Ask me questions while you tour the home.