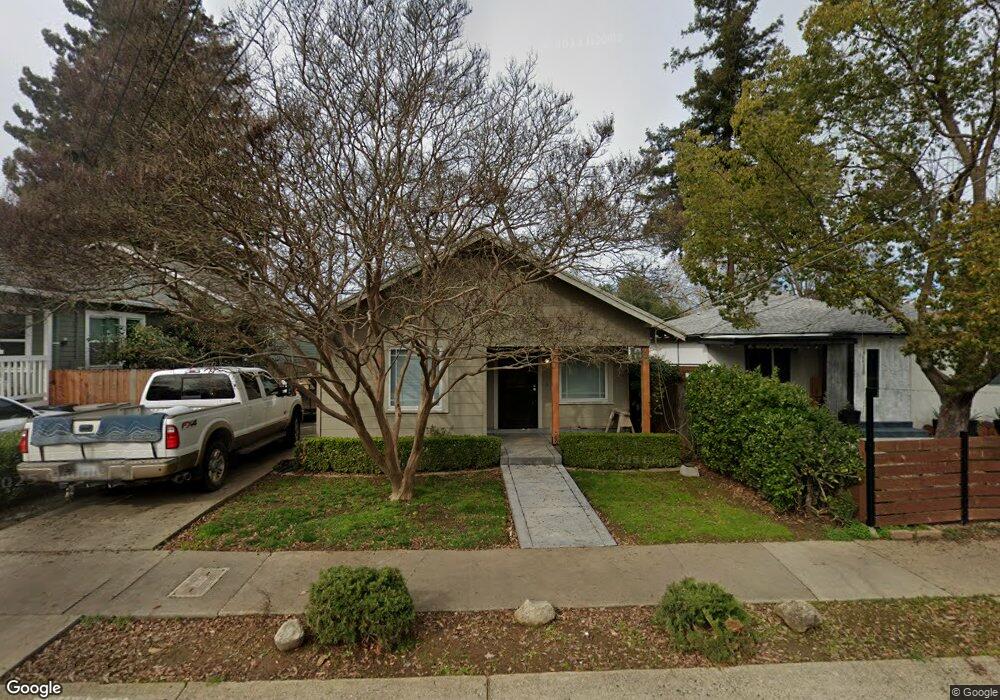
1134 49th St Sacramento, CA 95819
East Sacramento NeighborhoodEstimated Value: $513,000 - $592,000
2
Beds
1
Bath
804
Sq Ft
$686/Sq Ft
Est. Value
About This Home
This home is located at 1134 49th St, Sacramento, CA 95819 and is currently estimated at $551,883, approximately $686 per square foot. 1134 49th St is a home located in Sacramento County with nearby schools including Caleb Greenwood Elementary, Umoja International Academy, and Hiram W. Johnson High School.
Ownership History
Date
Name
Owned For
Owner Type
Purchase Details
Closed on
Jun 28, 2002
Sold by
Littletree Kenneth D
Bought by
Kitchens Pamela
Current Estimated Value
Home Financials for this Owner
Home Financials are based on the most recent Mortgage that was taken out on this home.
Original Mortgage
$168,000
Outstanding Balance
$71,976
Interest Rate
6.86%
Estimated Equity
$479,907
Purchase Details
Closed on
Jun 25, 2002
Sold by
Tobey J L and Tobey Beverly M
Bought by
Kitchens Pamela
Home Financials for this Owner
Home Financials are based on the most recent Mortgage that was taken out on this home.
Original Mortgage
$168,000
Outstanding Balance
$71,976
Interest Rate
6.86%
Estimated Equity
$479,907
Purchase Details
Closed on
Nov 15, 2001
Sold by
Tobey Beverly
Bought by
Tobey Beverly M and Beverly M Tobey Revocable Trus
Create a Home Valuation Report for This Property
The Home Valuation Report is an in-depth analysis detailing your home's value as well as a comparison with similar homes in the area
Home Values in the Area
Average Home Value in this Area
Purchase History
| Date | Buyer | Sale Price | Title Company |
|---|---|---|---|
| Kitchens Pamela | -- | Stewart Title | |
| Kitchens Pamela | $210,000 | Stewart Title | |
| Tobey Beverly M | -- | -- |
Source: Public Records
Mortgage History
| Date | Status | Borrower | Loan Amount |
|---|---|---|---|
| Open | Kitchens Pamela | $168,000 |
Source: Public Records
Tax History Compared to Growth
Tax History
| Year | Tax Paid | Tax Assessment Tax Assessment Total Assessment is a certain percentage of the fair market value that is determined by local assessors to be the total taxable value of land and additions on the property. | Land | Improvement |
|---|---|---|---|---|
| 2025 | $3,587 | $304,127 | $117,305 | $186,822 |
| 2024 | $3,587 | $298,164 | $115,005 | $183,159 |
| 2023 | $3,502 | $292,318 | $112,750 | $179,568 |
| 2022 | $3,443 | $286,588 | $110,540 | $176,048 |
| 2021 | $3,280 | $280,970 | $108,373 | $172,597 |
| 2020 | $3,307 | $278,090 | $107,262 | $170,828 |
| 2019 | $3,237 | $272,638 | $105,159 | $167,479 |
| 2018 | $3,153 | $267,294 | $103,098 | $164,196 |
| 2017 | $3,029 | $262,054 | $101,077 | $160,977 |
| 2016 | $2,957 | $256,917 | $99,096 | $157,821 |
| 2015 | $2,913 | $253,059 | $97,608 | $155,451 |
| 2014 | $2,833 | $248,102 | $95,696 | $152,406 |
Source: Public Records
Map
Nearby Homes