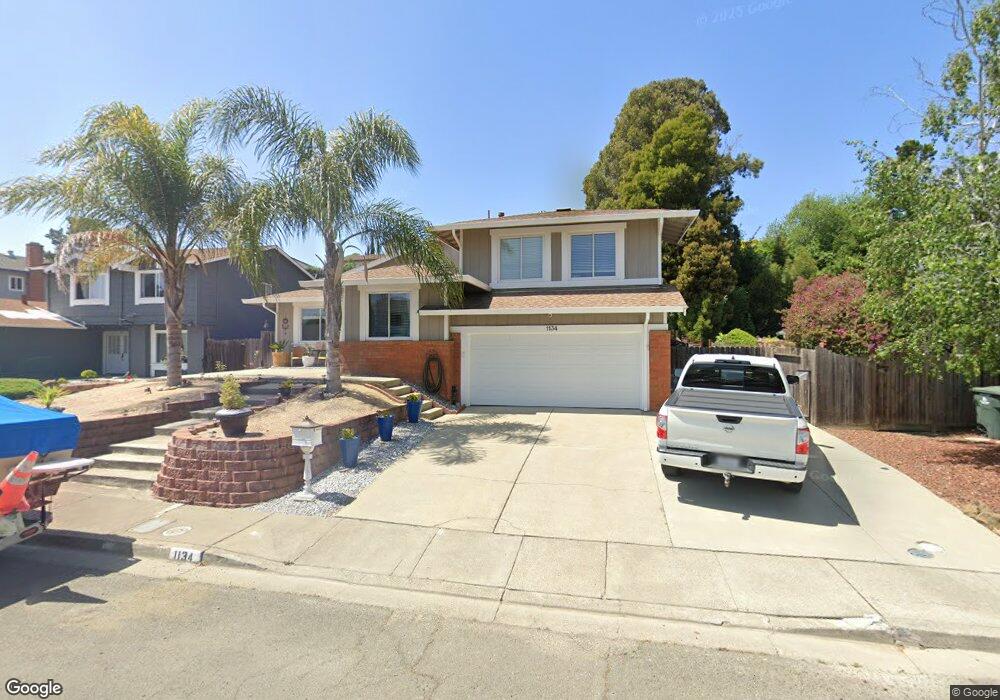
1134 Granada St Vallejo, CA 94591
Estimated Value: $617,000 - $678,000
4
Beds
3
Baths
1,931
Sq Ft
$338/Sq Ft
Est. Value
About This Home
This home is located at 1134 Granada St, Vallejo, CA 94591 and is currently estimated at $653,203, approximately $338 per square foot. 1134 Granada St is a home located in Solano County with nearby schools including Annie Pennycook Elementary School, Jesse M. Bethel High School, and Vallejo Charter School.
Ownership History
Date
Name
Owned For
Owner Type
Purchase Details
Closed on
Oct 11, 2019
Sold by
Williams Bradley S
Bought by
Dorrance Anouk Avivah and Casanova Anthony Thomas
Current Estimated Value
Home Financials for this Owner
Home Financials are based on the most recent Mortgage that was taken out on this home.
Original Mortgage
$484,350
Outstanding Balance
$424,315
Interest Rate
3.5%
Mortgage Type
New Conventional
Estimated Equity
$228,888
Purchase Details
Closed on
Dec 23, 2011
Sold by
Ford Edward Dan and Ford Dolores H
Bought by
Williams Bradley S
Home Financials for this Owner
Home Financials are based on the most recent Mortgage that was taken out on this home.
Original Mortgage
$218,996
Interest Rate
3.94%
Mortgage Type
VA
Create a Home Valuation Report for This Property
The Home Valuation Report is an in-depth analysis detailing your home's value as well as a comparison with similar homes in the area
Purchase History
| Date | Buyer | Sale Price | Title Company |
|---|---|---|---|
| Dorrance Anouk Avivah | $510,000 | Placer Title Company | |
| Williams Bradley S | $212,000 | Old Republic Title Company |
Source: Public Records
Mortgage History
| Date | Status | Borrower | Loan Amount |
|---|---|---|---|
| Open | Dorrance Anouk Avivah | $484,350 | |
| Previous Owner | Williams Bradley S | $218,996 |
Source: Public Records
Tax History
| Year | Tax Paid | Tax Assessment Tax Assessment Total Assessment is a certain percentage of the fair market value that is determined by local assessors to be the total taxable value of land and additions on the property. | Land | Improvement |
|---|---|---|---|---|
| 2025 | $7,499 | $557,756 | $153,108 | $404,648 |
| 2024 | $7,499 | $546,820 | $150,106 | $396,714 |
| 2023 | $7,144 | $536,099 | $147,163 | $388,936 |
| 2022 | $7,070 | $525,588 | $144,279 | $381,309 |
| 2021 | $6,904 | $515,283 | $141,450 | $373,833 |
| 2020 | $6,963 | $510,000 | $140,000 | $370,000 |
| 2019 | $4,110 | $238,703 | $56,297 | $182,406 |
| 2018 | $3,867 | $234,024 | $55,194 | $178,830 |
| 2017 | $3,705 | $229,436 | $54,112 | $175,324 |
| 2016 | $2,678 | $224,938 | $53,051 | $171,887 |
| 2015 | $2,643 | $221,561 | $52,255 | $169,306 |
| 2014 | $2,606 | $217,222 | $51,232 | $165,990 |
Source: Public Records
Map
Nearby Homes
- 118 Hydrangea Ct
- 199 Mariner Dr
- 8601 Rockaway Dr
- 108 Sunnyglen Dr
- 8620 Rockaway Dr
- 8707 Aquamarine Dr
- 8632 Rockaway Dr
- 112 Aragon Ct
- 709 Pope Dr
- 479 Aragon St
- 150 Yorkshire Ct
- 185 Lexington Dr
- 902 Bolton Cir
- 111 Elgin Ct
- 116 Greeves St
- 223 Toledo Ct
- 159 Coleridge Dr
- 235 Toledo Ct
- 501 Baywood Dr
- 1207 1 2 Warren Ave
- 1142 Granada St
- 1126 Granada St
- 1150 Granada St
- 1118 Granada St
- 121 Segovia Ct
- 130 Segovia Ct
- 120 Segovia Ct
- 1166 Granada St
- 1110 Granada St
- 111 Segovia Ct
- 1139 Granada St
- 1131 Granada St
- 110 Segovia Ct
- 1123 Granada St
- 1147 Granada St
- 1174 Granada St
- 1254 Granada St
- 1115 Granada St
- 1266 Granada St
- 101 Segovia Ct
Your Personal Tour Guide
Ask me questions while you tour the home.