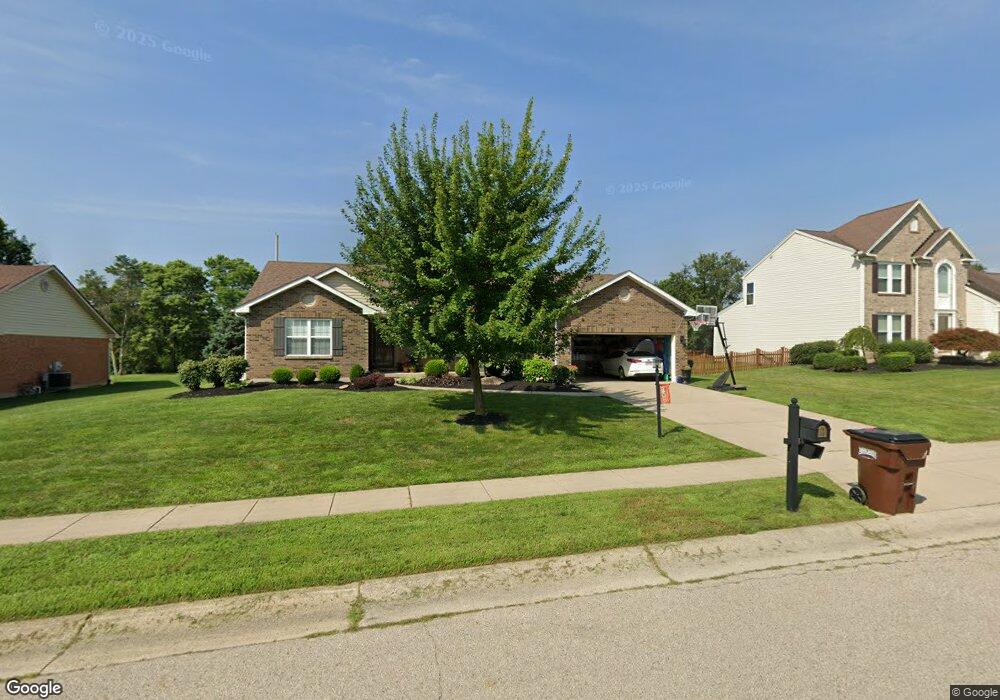
1134 Terrington Way Miamisburg, OH 45342
Downtown Miamisburg NeighborhoodEstimated Value: $344,887 - $392,000
3
Beds
2
Baths
1,810
Sq Ft
$203/Sq Ft
Est. Value
About This Home
This home is located at 1134 Terrington Way, Miamisburg, OH 45342 and is currently estimated at $366,972, approximately $202 per square foot. 1134 Terrington Way is a home located in Montgomery County with nearby schools including Miamisburg High School.
Ownership History
Date
Name
Owned For
Owner Type
Purchase Details
Closed on
Oct 21, 2016
Sold by
Godbey Floyd C
Bought by
Brian M Schwartz
Current Estimated Value
Home Financials for this Owner
Home Financials are based on the most recent Mortgage that was taken out on this home.
Interest Rate
3.52%
Purchase Details
Closed on
Oct 17, 2006
Sold by
Godbey Ruby F and Godbey Kirt F
Bought by
Godbey Ruby F and Godbey Floyd
Home Financials for this Owner
Home Financials are based on the most recent Mortgage that was taken out on this home.
Original Mortgage
$99,000
Interest Rate
6.45%
Mortgage Type
Stand Alone First
Purchase Details
Closed on
Dec 2, 2002
Sold by
Godbey Joe S
Bought by
Godbey Ruby F and Godbey Kirt F
Purchase Details
Closed on
Jul 29, 2002
Sold by
Bel Oak Realty Inc
Bought by
Godbey Ruby F and Godbey Joe S
Purchase Details
Closed on
Oct 17, 2000
Sold by
Gueltig & Black Development Company Ltd
Bought by
Bel Oak Realty Inc
Create a Home Valuation Report for This Property
The Home Valuation Report is an in-depth analysis detailing your home's value as well as a comparison with similar homes in the area
Home Values in the Area
Average Home Value in this Area
Purchase History
| Date | Buyer | Sale Price | Title Company |
|---|---|---|---|
| Brian M Schwartz | $212,500 | -- | |
| Godbey Ruby F | -- | Rockwood Title & Settlement | |
| Godbey Ruby F | -- | -- | |
| Godbey Ruby F | $203,000 | -- | |
| Bel Oak Realty Inc | $26,000 | -- |
Source: Public Records
Mortgage History
| Date | Status | Borrower | Loan Amount |
|---|---|---|---|
| Closed | Brian M Schwartz | -- | |
| Previous Owner | Godbey Ruby F | $99,000 |
Source: Public Records
Tax History Compared to Growth
Tax History
| Year | Tax Paid | Tax Assessment Tax Assessment Total Assessment is a certain percentage of the fair market value that is determined by local assessors to be the total taxable value of land and additions on the property. | Land | Improvement |
|---|---|---|---|---|
| 2024 | $6,488 | $102,360 | $17,640 | $84,720 |
| 2023 | $6,488 | $102,360 | $17,640 | $84,720 |
| 2022 | $6,109 | $81,240 | $14,000 | $67,240 |
| 2021 | $5,402 | $81,240 | $14,000 | $67,240 |
| 2020 | $5,389 | $81,240 | $14,000 | $67,240 |
| 2019 | $4,846 | $67,000 | $14,000 | $53,000 |
| 2018 | $4,862 | $67,000 | $14,000 | $53,000 |
| 2017 | $4,829 | $67,000 | $14,000 | $53,000 |
| 2016 | $4,431 | $57,630 | $14,000 | $43,630 |
| 2015 | $3,517 | $57,630 | $14,000 | $43,630 |
| 2014 | $3,517 | $56,650 | $14,000 | $42,650 |
| 2012 | -- | $65,300 | $14,000 | $51,300 |
Source: Public Records
Map
Nearby Homes
- 1126 Terrington Way
- 5561 Benner Rd
- 1387 Kelly Marie Ct
- 1265 Deer Valley Dr
- 1230 Deer Valley Dr
- Hudson with Finished Basement Plan at Deer Valley
- Alberti Ranch with Finished Basement Plan at Deer Valley
- Allegheny with Finished Basement Plan at Deer Valley
- Bramante Ranch with Finished Basement Plan at Deer Valley
- 1132 Nouvelle Dr
- 1045 S Linden Ave
- 00 Benner Rd
- 1331 Cherry Hill Dr
- 727 Harnam Ct
- 1013 S Heincke Rd
- 1035 Woods View Ct
- 1734 Rosina Dr
- 3 South Dr
- 5 South Dr
- 4 South Dr
- 1142 Terrington Way
- 1118 Terrington Way
- 1150 Terrington Way
- 1010 Umbreit Ct
- 1141 Terrington Way
- 1149 Terrington Way
- 1110 Terrington Way
- 1158 Terrington Way
- 1020 Umbreit Ct
- 1005 Umbreit Ct
- 1291 Colson Ct
- 1165 Terrington Way
- 1030 Umbreit Ct
- 1102 Terrington Way
- 1015 Umbreit Ct
- 1287 Colson Ct
- 1166 Terrington Way
- 930 Bakersfield Ct
- 1295 Colson Ct
- 1040 Umbreit Ct