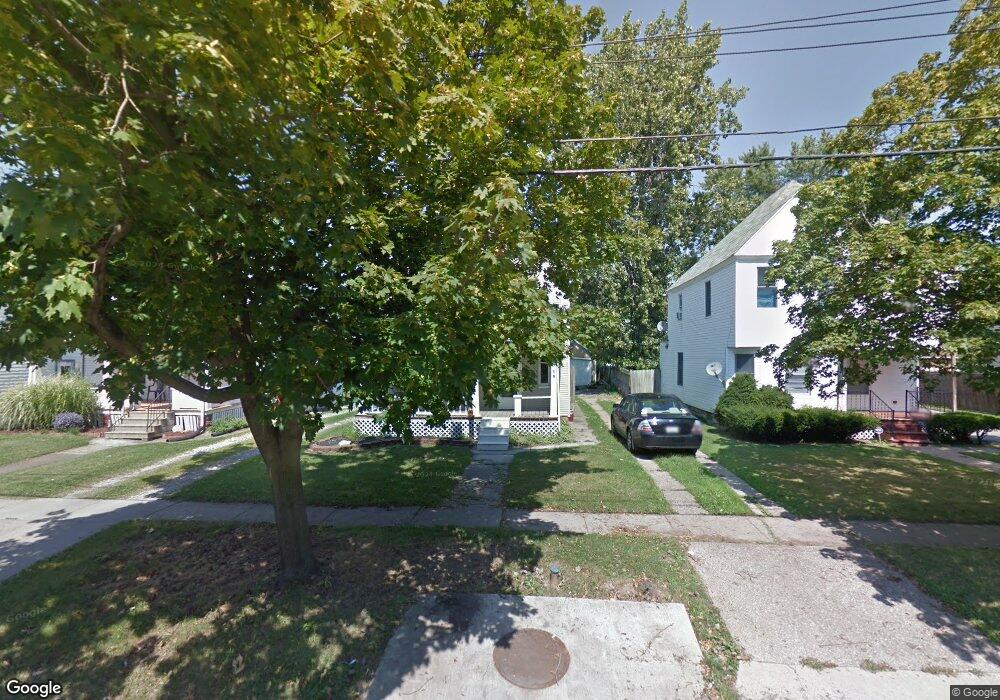
1134 W 9th St Lorain, OH 44052
Estimated Value: $98,000 - $149,000
3
Beds
2
Baths
1,344
Sq Ft
$87/Sq Ft
Est. Value
About This Home
This home is located at 1134 W 9th St, Lorain, OH 44052 and is currently estimated at $116,670, approximately $86 per square foot. 1134 W 9th St is a home located in Lorain County with nearby schools including Admiral King Elementary School, Longfellow Middle School, and Lorain High School.
Ownership History
Date
Name
Owned For
Owner Type
Purchase Details
Closed on
Mar 8, 2021
Sold by
Blue Ocean Properties Llc
Bought by
Rodriguez Eric and Rodriguez Michelle
Current Estimated Value
Purchase Details
Closed on
Feb 26, 2019
Sold by
Blue Ocean Properties Llc
Bought by
Rodriguez Eric
Home Financials for this Owner
Home Financials are based on the most recent Mortgage that was taken out on this home.
Original Mortgage
$46,530
Interest Rate
4.4%
Mortgage Type
Seller Take Back
Purchase Details
Closed on
Nov 9, 2018
Sold by
Slack Todd M and Slack Kristen R
Bought by
Blue Ocean Properties Llc
Purchase Details
Closed on
Jun 27, 2013
Sold by
Bennett John W
Bought by
Slack Todd M and Slack Kristen R
Purchase Details
Closed on
Sep 13, 1994
Sold by
Cochrane Mark A
Bought by
Bennett John W
Home Financials for this Owner
Home Financials are based on the most recent Mortgage that was taken out on this home.
Original Mortgage
$39,366
Interest Rate
8.65%
Mortgage Type
FHA
Create a Home Valuation Report for This Property
The Home Valuation Report is an in-depth analysis detailing your home's value as well as a comparison with similar homes in the area
Home Values in the Area
Average Home Value in this Area
Purchase History
| Date | Buyer | Sale Price | Title Company |
|---|---|---|---|
| Rodriguez Eric | $46,600 | None Listed On Document | |
| Rodriguez Eric | $51,700 | 1St Nationwide Title Agency | |
| Blue Ocean Properties Llc | $27,500 | Examco Title Servicesd | |
| Slack Todd M | $25,100 | None Available | |
| Bennett John W | $40,000 | -- |
Source: Public Records
Mortgage History
| Date | Status | Borrower | Loan Amount |
|---|---|---|---|
| Previous Owner | Rodriguez Eric | $46,530 | |
| Previous Owner | Bennett John W | $39,366 |
Source: Public Records
Tax History Compared to Growth
Tax History
| Year | Tax Paid | Tax Assessment Tax Assessment Total Assessment is a certain percentage of the fair market value that is determined by local assessors to be the total taxable value of land and additions on the property. | Land | Improvement |
|---|---|---|---|---|
| 2024 | $1,127 | $27,342 | $4,032 | $23,310 |
| 2023 | $1,122 | $21,777 | $3,651 | $18,127 |
| 2022 | $1,112 | $21,777 | $3,651 | $18,127 |
| 2021 | $1,141 | $21,777 | $3,651 | $18,127 |
| 2020 | $1,161 | $19,260 | $3,230 | $16,030 |
| 2019 | $1,155 | $19,260 | $3,230 | $16,030 |
| 2018 | $1,097 | $19,260 | $3,230 | $16,030 |
| 2017 | $1,038 | $16,320 | $3,630 | $12,690 |
| 2016 | $1,030 | $16,320 | $3,630 | $12,690 |
| 2015 | $973 | $16,320 | $3,630 | $12,690 |
| 2014 | $899 | $15,110 | $3,360 | $11,750 |
| 2013 | $892 | $15,110 | $3,360 | $11,750 |
Source: Public Records
Map
Nearby Homes
- 1136 W 9th St
- 1130 W 9th St
- 1140 W 9th St
- 1146 W 9th St
- 1126 W 9th St
- 1144 W 9th St
- 1144 W 9th St Unit Floor 2
- 1167 W 8th St
- 1122 W 9th St
- 1171 W 8th St
- 1157 W 8th St
- 1175 W 8th St
- 1118 W 9th St
- 1137 W 9th St Unit (AUCTION
- 1150 W 9th St
- 1153 W 8th St
- 1177 W 8th St
- 827 Oberlin Ave
- 1135 W 9th St
- 1131 W 9th St Unit 3