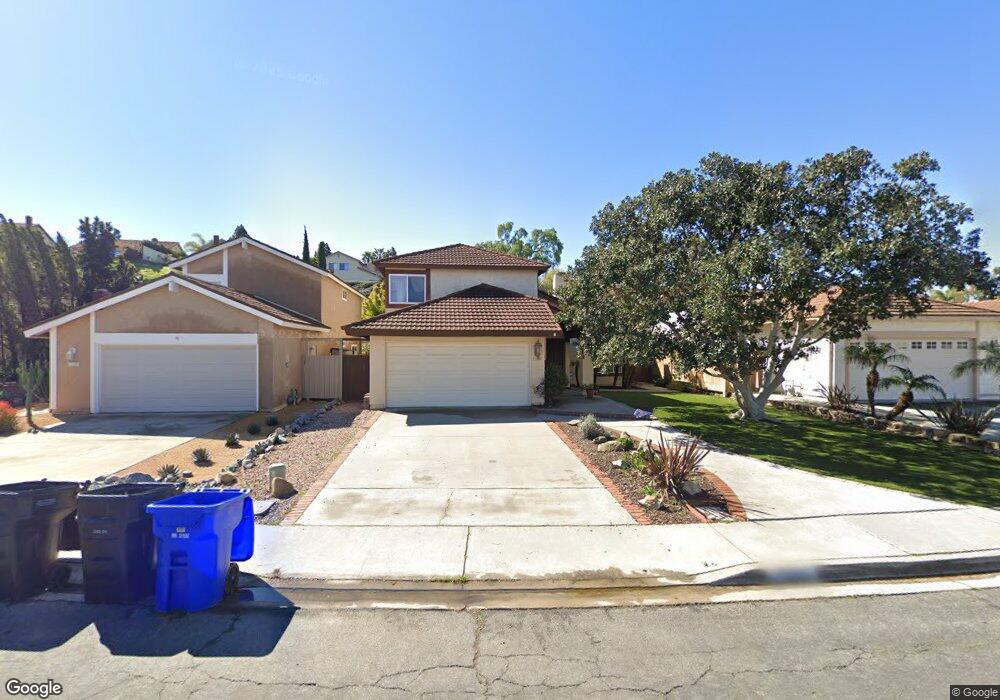
11341 Turtleback Ln San Diego, CA 92127
Rancho Bernardo NeighborhoodEstimated Value: $1,424,000 - $1,587,000
4
Beds
3
Baths
2,181
Sq Ft
$674/Sq Ft
Est. Value
About This Home
This home is located at 11341 Turtleback Ln, San Diego, CA 92127 and is currently estimated at $1,470,006, approximately $674 per square foot. 11341 Turtleback Ln is a home located in San Diego County with nearby schools including Turtleback Elementary, Bernardo Heights Middle, and Rancho Bernardo High.
Ownership History
Date
Name
Owned For
Owner Type
Purchase Details
Closed on
Jan 20, 2009
Sold by
Regner Randolph W and Regner Carol Layton
Bought by
Miller Jeffrey D and Miller Robyn C
Current Estimated Value
Home Financials for this Owner
Home Financials are based on the most recent Mortgage that was taken out on this home.
Original Mortgage
$444,000
Outstanding Balance
$278,540
Interest Rate
5.04%
Mortgage Type
Unknown
Estimated Equity
$1,191,466
Purchase Details
Closed on
Aug 29, 2002
Sold by
Stuart Leroy D and Stuart Linda D
Bought by
Regner Randolph W E and Regner Carol A
Home Financials for this Owner
Home Financials are based on the most recent Mortgage that was taken out on this home.
Original Mortgage
$350,000
Interest Rate
6.09%
Purchase Details
Closed on
Mar 11, 1996
Sold by
Stuart Leroy D and Stuart Linda D
Bought by
Stuart Leroy D and Stuart Linda D
Create a Home Valuation Report for This Property
The Home Valuation Report is an in-depth analysis detailing your home's value as well as a comparison with similar homes in the area
Home Values in the Area
Average Home Value in this Area
Purchase History
| Date | Buyer | Sale Price | Title Company |
|---|---|---|---|
| Miller Jeffrey D | $555,000 | Equity Title Company | |
| Regner Randolph W E | $450,000 | American Title Co | |
| Stuart Leroy D | -- | -- |
Source: Public Records
Mortgage History
| Date | Status | Borrower | Loan Amount |
|---|---|---|---|
| Open | Miller Jeffrey D | $444,000 | |
| Previous Owner | Regner Randolph W E | $350,000 |
Source: Public Records
Tax History
| Year | Tax Paid | Tax Assessment Tax Assessment Total Assessment is a certain percentage of the fair market value that is determined by local assessors to be the total taxable value of land and additions on the property. | Land | Improvement |
|---|---|---|---|---|
| 2025 | $7,864 | $714,686 | $450,705 | $263,981 |
| 2024 | $7,864 | $700,673 | $441,868 | $258,805 |
| 2023 | $7,696 | $686,935 | $433,204 | $253,731 |
| 2022 | $7,567 | $673,466 | $424,710 | $248,756 |
| 2021 | $7,467 | $660,262 | $416,383 | $243,879 |
| 2020 | $7,366 | $653,493 | $412,114 | $241,379 |
| 2019 | $7,173 | $640,681 | $404,034 | $236,647 |
| 2018 | $6,970 | $628,119 | $396,112 | $232,007 |
| 2017 | $83 | $615,804 | $388,346 | $227,458 |
| 2016 | $6,643 | $603,731 | $380,732 | $222,999 |
| 2015 | $6,543 | $594,664 | $375,014 | $219,650 |
| 2014 | $6,388 | $583,016 | $367,668 | $215,348 |
Source: Public Records
Map
Nearby Homes
- 11525 Eaglesview Ct Unit 4
- 15293 Maturin Dr Unit 91
- 15273 Maturin Dr Unit 40
- 15383 Maturin Dr Unit 221
- 15393 Maturin Dr Unit 243
- 16244 Avenida Venusto Unit A
- 16232 Avenida Venusto Unit B
- 11325 Avenida de Los Lobos
- 11337 Avenida de Los Lobos Unit C
- 11705 Via Medanos
- 11231 Avenida de Los Lobos Unit H
- 16458 Avenida Venusto Unit E
- 16458 Avenida Venusto Unit C
- 16464 Avenida Venusto
- 11602 Calle Paracho
- 12141 Iron View Row
- 11941 Callado Rd
- 16731 Acena Dr
- 12131 View Pointe Row
- 12047 Avenida Consentido
- 11333 Turtleback Ln
- 11349 Turtleback Ln
- 11357 Turtleback Ln
- 11325 Turtleback Ln
- 16225 Turtleback Rd
- 11328 Cloudcrest Dr
- 11365 Turtleback Ln
- 11318 Cloudcrest Dr
- 11338 Cloudcrest Dr
- 11310 Cloudcrest Dr
- 11348 Cloudcrest Dr
- 11373 Turtleback Ln
- 11350 Turtleback Ln
- 11358 Turtleback Ln
- 11334 Turtleback Ln
- 11326 Turtleback Ln
- 11366 Turtleback Ln
- 11318 Turtleback Ln
- 11358 Cloudcrest Dr Unit 2
- 11381 Turtleback Ln
Your Personal Tour Guide
Ask me questions while you tour the home.