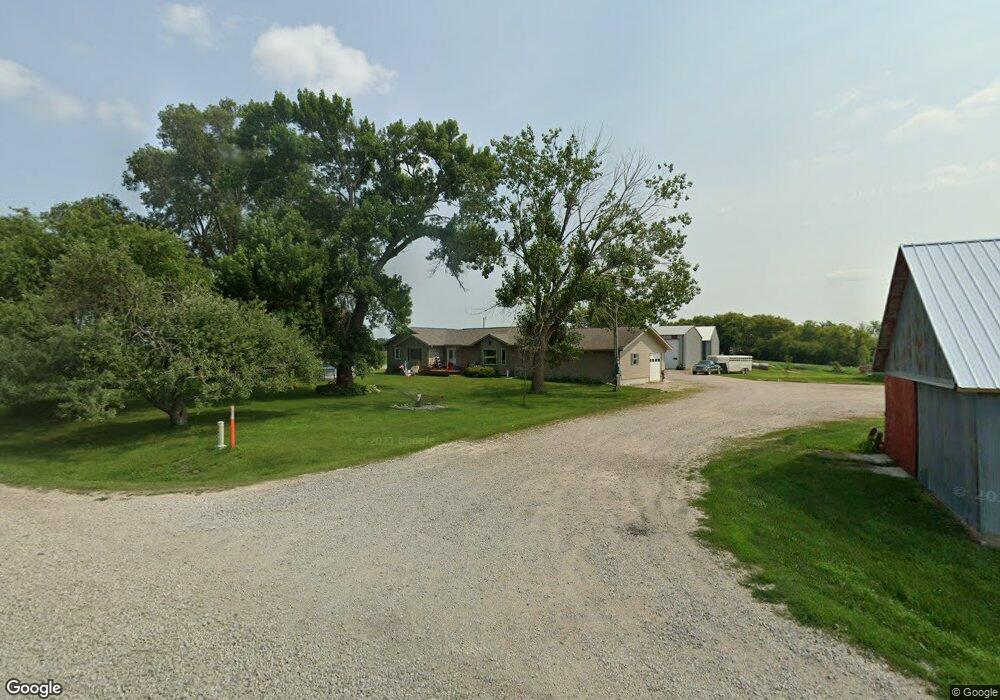
11342 Floyd Line St Dougherty, IA 50433
Estimated Value: $525,541 - $1,918,000
3
Beds
1
Bath
2,192
Sq Ft
$555/Sq Ft
Est. Value
About This Home
This home is located at 11342 Floyd Line St, Dougherty, IA 50433 and is currently estimated at $1,217,514, approximately $555 per square foot. 11342 Floyd Line St is a home located in Butler County with nearby schools including North Butler Junior/Senior High School.
Ownership History
Date
Name
Owned For
Owner Type
Purchase Details
Closed on
Jul 23, 2008
Sold by
Brandt Ag Ltd
Bought by
Muth David J
Current Estimated Value
Home Financials for this Owner
Home Financials are based on the most recent Mortgage that was taken out on this home.
Original Mortgage
$1,045,000
Outstanding Balance
$518,970
Interest Rate
6.39%
Mortgage Type
Credit Line Revolving
Estimated Equity
$698,544
Purchase Details
Closed on
Dec 18, 2007
Sold by
Muth Melanie M
Bought by
Muth David J
Create a Home Valuation Report for This Property
The Home Valuation Report is an in-depth analysis detailing your home's value as well as a comparison with similar homes in the area
Home Values in the Area
Average Home Value in this Area
Purchase History
| Date | Buyer | Sale Price | Title Company |
|---|---|---|---|
| Muth David J | $1,089,500 | None Available | |
| Muth David J | -- | None Available |
Source: Public Records
Mortgage History
| Date | Status | Borrower | Loan Amount |
|---|---|---|---|
| Open | Muth David J | $1,045,000 |
Source: Public Records
Tax History Compared to Growth
Tax History
| Year | Tax Paid | Tax Assessment Tax Assessment Total Assessment is a certain percentage of the fair market value that is determined by local assessors to be the total taxable value of land and additions on the property. | Land | Improvement |
|---|---|---|---|---|
| 2024 | $5,392 | $445,270 | $10,580 | $434,690 |
| 2023 | $5,310 | $445,270 | $10,580 | $434,690 |
| 2022 | $4,966 | $348,590 | $8,260 | $340,330 |
| 2021 | $4,034 | $348,590 | $8,260 | $340,330 |
| 2020 | $4,034 | $281,040 | $8,440 | $272,600 |
| 2019 | $3,758 | $288,770 | $0 | $0 |
| 2018 | $3,708 | $288,770 | $0 | $0 |
| 2017 | $3,708 | $331,180 | $0 | $0 |
| 2016 | $4,188 | $331,180 | $0 | $0 |
| 2015 | $4,188 | $390,330 | $0 | $0 |
| 2014 | $4,716 | $390,330 | $0 | $0 |
Source: Public Records
Map
Nearby Homes