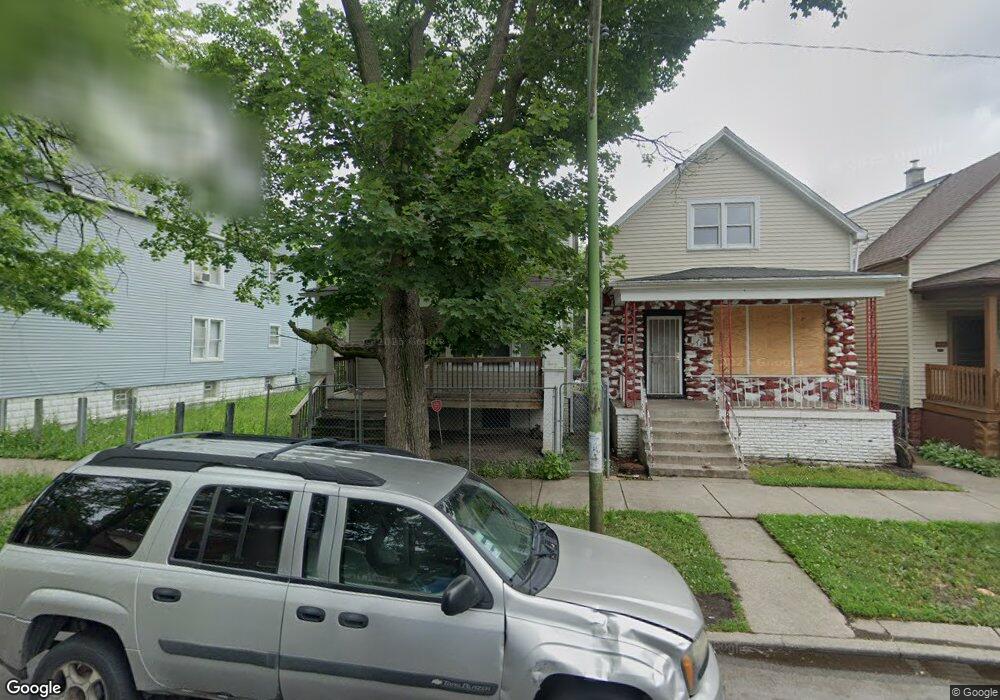
11343 S Edbrooke Ave Chicago, IL 60628
Roseland NeighborhoodEstimated Value: $194,586 - $224,000
4
Beds
2
Baths
2,040
Sq Ft
$102/Sq Ft
Est. Value
About This Home
This home is located at 11343 S Edbrooke Ave, Chicago, IL 60628 and is currently estimated at $207,147, approximately $101 per square foot. 11343 S Edbrooke Ave is a home located in Cook County with nearby schools including Curtis Elementary School, Corliss High School, and CICS Prairie.
Ownership History
Date
Name
Owned For
Owner Type
Purchase Details
Closed on
Aug 9, 2024
Sold by
Bw Development Llc
Bought by
Martinez Luis Moises
Current Estimated Value
Home Financials for this Owner
Home Financials are based on the most recent Mortgage that was taken out on this home.
Original Mortgage
$175,824
Outstanding Balance
$173,586
Interest Rate
6.25%
Mortgage Type
FHA
Estimated Equity
$33,561
Purchase Details
Closed on
May 27, 2009
Sold by
Hsbc Bank Usa National Association
Bought by
B W Development Llc
Purchase Details
Closed on
Apr 8, 2009
Sold by
Jackson
Bought by
Hsbc Bank Usa National Association
Purchase Details
Closed on
Sep 8, 2005
Sold by
Us Bank Na
Bought by
Jackson Anton
Home Financials for this Owner
Home Financials are based on the most recent Mortgage that was taken out on this home.
Original Mortgage
$108,000
Interest Rate
5.82%
Mortgage Type
Fannie Mae Freddie Mac
Purchase Details
Closed on
Mar 17, 2005
Sold by
Orr David D
Bought by
Us Bank Na Trust #7994
Create a Home Valuation Report for This Property
The Home Valuation Report is an in-depth analysis detailing your home's value as well as a comparison with similar homes in the area
Home Values in the Area
Average Home Value in this Area
Purchase History
| Date | Buyer | Sale Price | Title Company |
|---|---|---|---|
| Martinez Luis Moises | $192,000 | Fidelity National Title | |
| B W Development Llc | $7,500 | 1St American Title | |
| Hsbc Bank Usa National Association | -- | None Available | |
| Jackson Anton | $135,000 | -- | |
| Us Bank Na Trust #7994 | -- | Ticor Title |
Source: Public Records
Mortgage History
| Date | Status | Borrower | Loan Amount |
|---|---|---|---|
| Open | Martinez Luis Moises | $175,824 | |
| Previous Owner | Jackson Anton | $108,000 |
Source: Public Records
Tax History Compared to Growth
Tax History
| Year | Tax Paid | Tax Assessment Tax Assessment Total Assessment is a certain percentage of the fair market value that is determined by local assessors to be the total taxable value of land and additions on the property. | Land | Improvement |
|---|---|---|---|---|
| 2024 | $978 | $6,300 | $2,040 | $4,260 |
| 2023 | $954 | $4,623 | $3,230 | $1,393 |
| 2022 | $954 | $4,623 | $3,230 | $1,393 |
| 2021 | $932 | $4,623 | $3,230 | $1,393 |
| 2020 | $2,452 | $10,981 | $2,210 | $8,771 |
| 2019 | $2,458 | $12,202 | $2,210 | $9,992 |
| 2018 | $2,416 | $12,202 | $2,210 | $9,992 |
| 2017 | $1,822 | $8,444 | $2,040 | $6,404 |
| 2016 | $1,695 | $8,444 | $2,040 | $6,404 |
| 2015 | $1,551 | $8,444 | $2,040 | $6,404 |
| 2014 | $1,452 | $7,804 | $1,700 | $6,104 |
| 2013 | $1,423 | $7,804 | $1,700 | $6,104 |
Source: Public Records
Map
Nearby Homes
- 11317 S Edbrooke Ave
- 11241 S Michigan Ave
- 11419 S Prairie Ave
- 26 E 113th St
- 11365 S Forest Ave
- 1 E 114th St
- 1 W 112th Place
- 11437 S Calumet Ave
- 120 E Kensington Ave
- 11418 S King Dr
- 26 W 114th St
- 11230 S Vernon Ave
- 129 E Kensington Ave
- 6 W 111th Place
- 11208 S Vernon Ave
- 62 W 113th St
- 22 E 112th St
- 106 W 114th St
- 11548 S State St
- 12551-53 S State St
- 11345 S Edbrooke Ave
- 11349 S Edbrooke Ave
- 11339 S Edbrooke Ave
- 11351 S Edbrooke Ave
- 11335 S Edbrooke Ave
- 11357 S Edbrooke Ave
- 11331 S Edbrooke Ave Unit 2
- 11342 S Indiana Ave
- 11342 S Indiana Ave Unit 3R
- 11342 S Indiana Ave Unit 3RA
- 11327 S Edbrooke Ave
- 11361 S Edbrooke Ave
- 11344 S Edbrooke Ave Unit 2
- 11344 S Edbrooke Ave Unit 1
- 11336 S Indiana Ave
- 11346 S Indiana Ave
- 11354 S Indiana Ave Unit 2
- 11332 S Indiana Ave
- 11325 S Edbrooke Ave
- 11350 S Indiana Ave