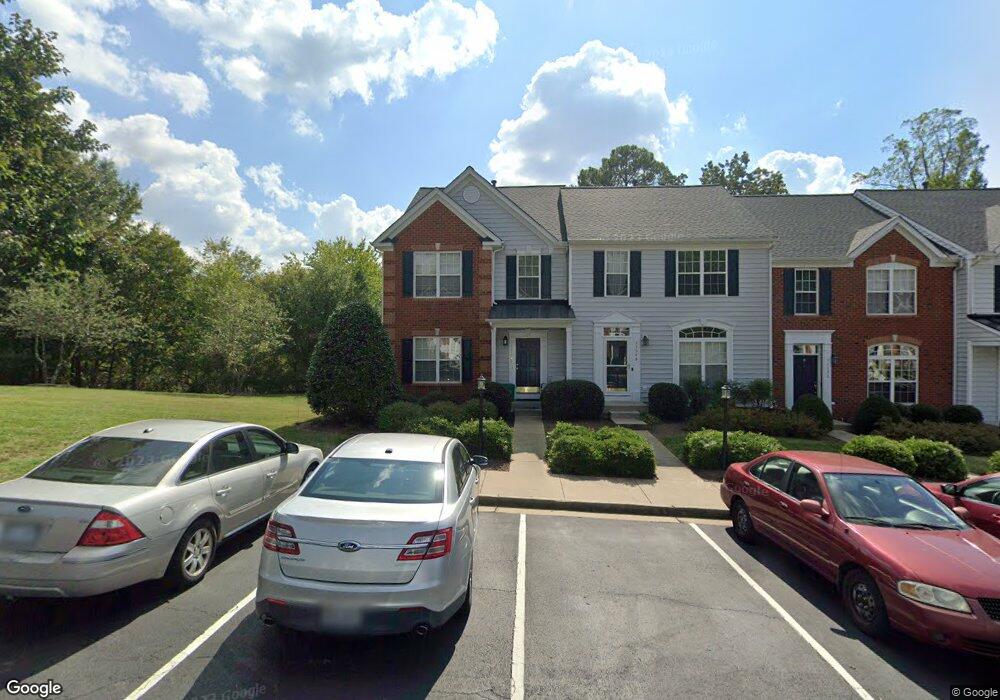
11346 Abbots Cross Ln Unit (END) Glen Allen, VA 23059
Echo Lake NeighborhoodEstimated Value: $423,000 - $440,229
3
Beds
4
Baths
2,862
Sq Ft
$151/Sq Ft
Est. Value
About This Home
This home is located at 11346 Abbots Cross Ln Unit (END), Glen Allen, VA 23059 and is currently estimated at $432,057, approximately $150 per square foot. 11346 Abbots Cross Ln Unit (END) is a home located in Henrico County with nearby schools including Glen Allen Elementary School, Hungary Creek Middle School, and Glen Allen High School.
Ownership History
Date
Name
Owned For
Owner Type
Purchase Details
Closed on
Feb 15, 2012
Sold by
Fannie Mae
Bought by
Peter Gregory J and Wang Hongiun
Current Estimated Value
Home Financials for this Owner
Home Financials are based on the most recent Mortgage that was taken out on this home.
Original Mortgage
$167,200
Outstanding Balance
$114,769
Interest Rate
3.93%
Mortgage Type
New Conventional
Estimated Equity
$317,288
Purchase Details
Closed on
Nov 7, 2011
Sold by
Prof Forec Corp Of Va Subtr
Bought by
Federal National Mortgage Association
Purchase Details
Closed on
Mar 1, 2006
Sold by
Nvr Inc
Bought by
Kennedy James F
Home Financials for this Owner
Home Financials are based on the most recent Mortgage that was taken out on this home.
Original Mortgage
$235,992
Interest Rate
6.27%
Mortgage Type
New Conventional
Purchase Details
Closed on
Nov 29, 2005
Sold by
Hunton Rth Development Co
Bought by
Nvr Inc
Create a Home Valuation Report for This Property
The Home Valuation Report is an in-depth analysis detailing your home's value as well as a comparison with similar homes in the area
Home Values in the Area
Average Home Value in this Area
Purchase History
| Date | Buyer | Sale Price | Title Company |
|---|---|---|---|
| Peter Gregory J | $209,000 | -- | |
| Federal National Mortgage Association | $263,042 | -- | |
| Kennedy James F | $294,990 | -- | |
| Nvr Inc | $274,095 | -- |
Source: Public Records
Mortgage History
| Date | Status | Borrower | Loan Amount |
|---|---|---|---|
| Open | Peter Gregory J | $167,200 | |
| Previous Owner | Kennedy James F | $235,992 |
Source: Public Records
Tax History Compared to Growth
Tax History
| Year | Tax Paid | Tax Assessment Tax Assessment Total Assessment is a certain percentage of the fair market value that is determined by local assessors to be the total taxable value of land and additions on the property. | Land | Improvement |
|---|---|---|---|---|
| 2025 | $3,454 | $408,300 | $77,000 | $331,300 |
| 2024 | $3,454 | $391,200 | $71,500 | $319,700 |
| 2023 | $3,325 | $391,200 | $71,500 | $319,700 |
| 2022 | $2,995 | $352,400 | $60,500 | $291,900 |
| 2021 | $2,722 | $308,400 | $55,000 | $253,400 |
| 2020 | $2,683 | $308,400 | $55,000 | $253,400 |
| 2019 | $2,525 | $290,200 | $55,000 | $235,200 |
| 2018 | $2,466 | $283,400 | $55,000 | $228,400 |
| 2017 | $2,326 | $267,300 | $55,000 | $212,300 |
| 2016 | $2,166 | $249,000 | $55,000 | $194,000 |
| 2015 | $2,166 | $249,000 | $55,000 | $194,000 |
| 2014 | $2,166 | $249,000 | $55,000 | $194,000 |
Source: Public Records
Map
Nearby Homes
- 3805 Mill Pine Ct
- 11572 Chapman Mill Dr
- 505 Siena Ln
- 3904 Links Ln
- 3908 Lyons Mill Ln
- 3916 Lyons Mill Ln
- JAMESTOWN Plan at Sheppard Mill
- Hampton Plan at Sheppard Mill
- SUMMIT Plan at Sheppard Mill
- WESTERLY Plan at Sheppard Mill
- VANDERBILT Plan at Sheppard Mill
- 11416 Creery Rd
- 11601 Sethwarner Dr
- 11415 Colfax Rd
- 5929 Moriano Terrace
- 11213 Carrington Green Dr
- 11300 Brooks St
- 3225 Lakewood Rd
- 10510 Courtney Rd
- 6009 Topping Ln
- 11346 Abbots Cross Ln
- 11346 Abbots Cross Ln
- 11348 Abbots Cross Ln
- 11348 Abbots Cross Ln
- 11350 Abbots Cross Ln
- 11350 Abbots Cross Ln
- 11350 Abbots Cross Ln Unit *
- 11350 Abbots Cross Ln Unit INTERIOR
- 11352 Abbots Cross Ln
- 11352 Abbots Cross Ln
- 11352 Abbots Cross Ln Unit INTERIOR
- 11354 Abbots Cross Ln
- 11356 Abbots Cross Ln
- 11358 Abbots Cross Ln
- 11347 Abbots Cross Ln
- 11347 Abbots Cross Ln Unit n/a
- 11347 Abbots Cross Ln
- 11347 Abbots Cross Ln Unit INTERIOR
- 11343 Abbots Cross Ln
- 11343 Abbots Cross Ln Unit 11343