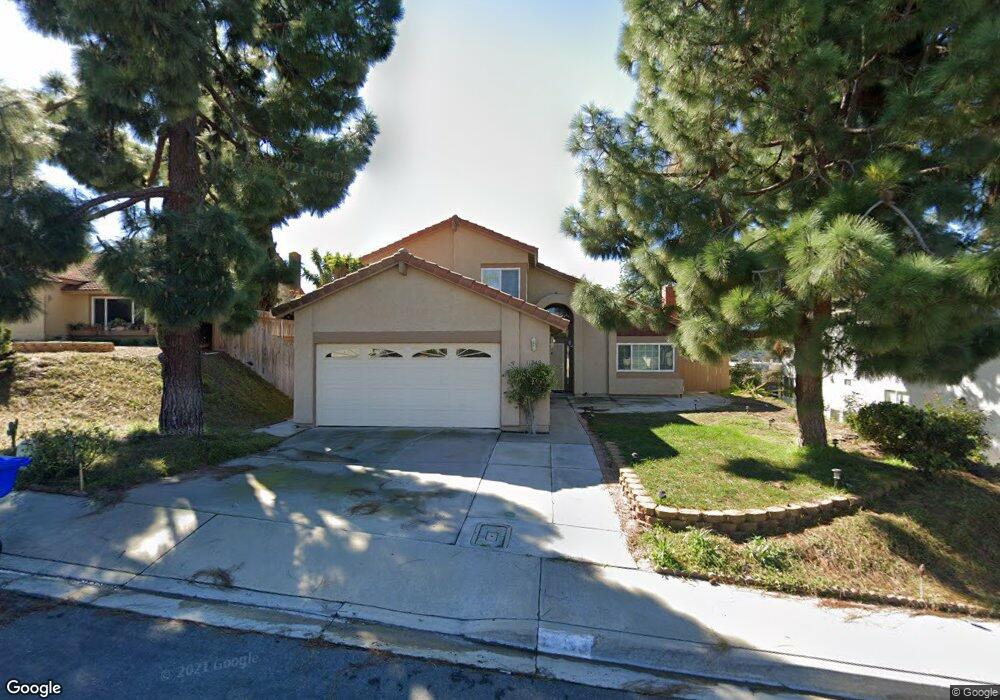
11349 Cloudcrest Dr Unit 2 San Diego, CA 92127
Rancho Bernardo NeighborhoodEstimated Value: $1,192,482 - $1,356,000
4
Beds
2
Baths
1,823
Sq Ft
$703/Sq Ft
Est. Value
About This Home
This home is located at 11349 Cloudcrest Dr Unit 2, San Diego, CA 92127 and is currently estimated at $1,282,371, approximately $703 per square foot. 11349 Cloudcrest Dr Unit 2 is a home located in San Diego County with nearby schools including Turtleback Elementary, Bernardo Heights Middle, and Rancho Bernardo High.
Ownership History
Date
Name
Owned For
Owner Type
Purchase Details
Closed on
Jul 18, 2019
Sold by
Vuong Richard and Ngo Cynthia
Bought by
Vuong Richard and Ngo Cynthia
Current Estimated Value
Purchase Details
Closed on
Sep 7, 2011
Sold by
Vuong Richard Kim and Ngo Cynthia
Bought by
Vuong Richard Kim and Ngo Cynthia
Home Financials for this Owner
Home Financials are based on the most recent Mortgage that was taken out on this home.
Original Mortgage
$134,000
Outstanding Balance
$11,287
Interest Rate
3.51%
Mortgage Type
New Conventional
Estimated Equity
$1,271,084
Purchase Details
Closed on
Feb 26, 2002
Sold by
Huang Johnny Chieu Hong and Huang Agnes Shu Chiao
Bought by
Vuong Richard and Ngo Cynthia
Home Financials for this Owner
Home Financials are based on the most recent Mortgage that was taken out on this home.
Original Mortgage
$270,000
Outstanding Balance
$111,118
Interest Rate
6.85%
Estimated Equity
$1,171,253
Create a Home Valuation Report for This Property
The Home Valuation Report is an in-depth analysis detailing your home's value as well as a comparison with similar homes in the area
Home Values in the Area
Average Home Value in this Area
Purchase History
| Date | Buyer | Sale Price | Title Company |
|---|---|---|---|
| Vuong Richard | -- | None Available | |
| Vuong Richard Kim | -- | First American Title Company | |
| Vuong Richard | $368,000 | National Title |
Source: Public Records
Mortgage History
| Date | Status | Borrower | Loan Amount |
|---|---|---|---|
| Open | Vuong Richard Kim | $134,000 | |
| Open | Vuong Richard | $270,000 |
Source: Public Records
Tax History Compared to Growth
Tax History
| Year | Tax Paid | Tax Assessment Tax Assessment Total Assessment is a certain percentage of the fair market value that is determined by local assessors to be the total taxable value of land and additions on the property. | Land | Improvement |
|---|---|---|---|---|
| 2025 | $6,221 | $565,787 | $295,451 | $270,336 |
| 2024 | $6,221 | $554,694 | $289,658 | $265,036 |
| 2023 | $6,088 | $543,819 | $283,979 | $259,840 |
| 2022 | $5,985 | $533,157 | $278,411 | $254,746 |
| 2021 | $5,906 | $522,703 | $272,952 | $249,751 |
| 2020 | $5,826 | $517,345 | $270,154 | $247,191 |
| 2019 | $5,674 | $507,202 | $264,857 | $242,345 |
| 2018 | $5,295 | $477,650 | $259,664 | $217,986 |
| 2017 | $5,152 | $468,285 | $254,573 | $213,712 |
| 2016 | $5,045 | $459,104 | $249,582 | $209,522 |
| 2015 | $4,970 | $452,209 | $245,834 | $206,375 |
| 2014 | $4,852 | $443,352 | $241,019 | $202,333 |
Source: Public Records
Map
Nearby Homes
- 11781 Caminito de Las Missiones
- 16003 Caminito de Linda
- 15353 Maturin Dr Unit 115
- 15273 Maturin Dr Unit 40
- 16232 Avenida Venusto Unit B
- 16244 Avenida Venusto Unit A
- 15373 Maturin Dr Unit 178
- 15283 Maturin Dr Unit 62
- 11705 Via Medanos
- 16430 Avenida Venusto Unit D
- 11313 Avenida de Los Lobos Unit B
- 11263 Avenida de Los Lobos Unit D
- 16205 Via Embeleso
- 12141 Iron View Row
- 15610 Corte Raposo
- 12105 View Pointe Row
- 12047 Avenida Consentido
- 16731 Acena Dr
- 15985 Camino Crisalida Unit 5
- 12085 Calle de Maria
- 11359 Cloudcrest Dr
- 11339 Cloudcrest Dr
- 11340 Trailside Way
- 11369 Cloudcrest Dr
- 11329 Cloudcrest Dr
- 11330 Trailside Way
- 11348 Cloudcrest Dr
- 11358 Cloudcrest Dr Unit 2
- 11379 Cloudcrest Dr
- 11321 Cloudcrest Dr
- 11338 Cloudcrest Dr
- 11320 Trailside Way Unit 1
- 11368 Cloudcrest Dr
- 11350 Trailside Way
- 11328 Cloudcrest Dr
- 11378 Cloudcrest Dr
- 11389 Cloudcrest Dr
- 16171 Turtleback Rd
- 11311 Cloudcrest Dr
- 11388 Cloudcrest Dr