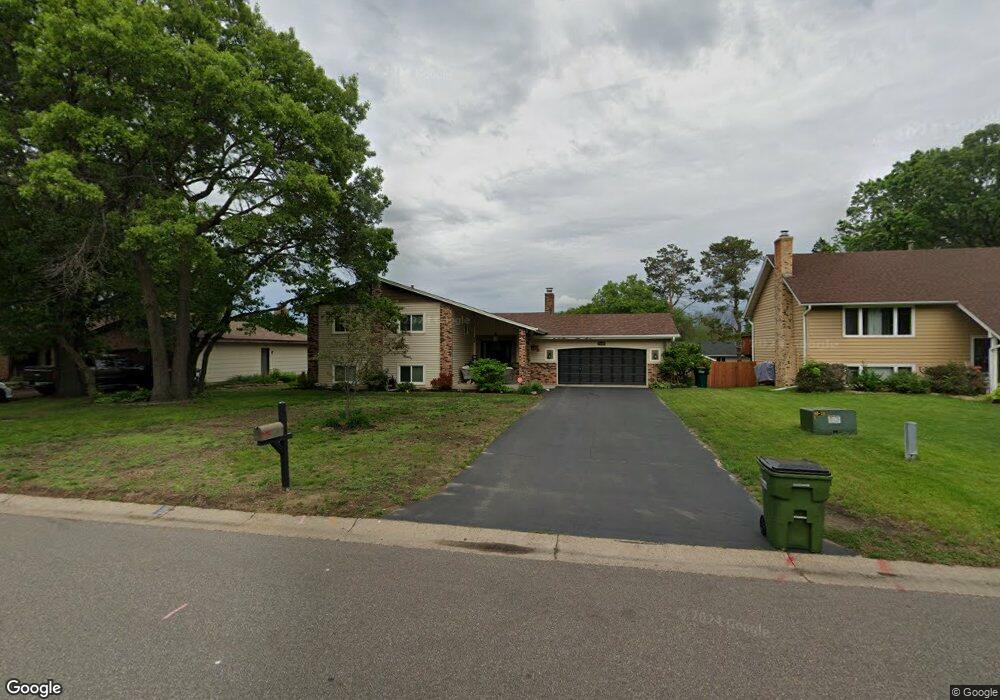
11349 Quincy St NE Minneapolis, MN 55434
Estimated Value: $351,000 - $400,000
4
Beds
2
Baths
1,428
Sq Ft
$268/Sq Ft
Est. Value
About This Home
This home is located at 11349 Quincy St NE, Minneapolis, MN 55434 and is currently estimated at $382,312, approximately $267 per square foot. 11349 Quincy St NE is a home located in Anoka County with nearby schools including Jefferson Elementary School, Northdale Middle School, and Blaine Senior High School.
Ownership History
Date
Name
Owned For
Owner Type
Purchase Details
Closed on
Jun 30, 2005
Sold by
George Mark A and George Doni S
Bought by
Poorman Mark A and Poorman Connie E
Current Estimated Value
Home Financials for this Owner
Home Financials are based on the most recent Mortgage that was taken out on this home.
Original Mortgage
$213,300
Outstanding Balance
$121,770
Interest Rate
7.14%
Mortgage Type
Adjustable Rate Mortgage/ARM
Estimated Equity
$260,542
Create a Home Valuation Report for This Property
The Home Valuation Report is an in-depth analysis detailing your home's value as well as a comparison with similar homes in the area
Home Values in the Area
Average Home Value in this Area
Purchase History
| Date | Buyer | Sale Price | Title Company |
|---|---|---|---|
| Poorman Mark A | $237,000 | -- |
Source: Public Records
Mortgage History
| Date | Status | Borrower | Loan Amount |
|---|---|---|---|
| Open | Poorman Mark A | $213,300 |
Source: Public Records
Tax History Compared to Growth
Tax History
| Year | Tax Paid | Tax Assessment Tax Assessment Total Assessment is a certain percentage of the fair market value that is determined by local assessors to be the total taxable value of land and additions on the property. | Land | Improvement |
|---|---|---|---|---|
| 2025 | $4,044 | $364,300 | $110,000 | $254,300 |
| 2024 | $4,044 | $363,700 | $108,200 | $255,500 |
| 2023 | $3,561 | $361,000 | $100,000 | $261,000 |
| 2022 | $3,377 | $347,000 | $86,400 | $260,600 |
| 2021 | $2,968 | $286,700 | $75,000 | $211,700 |
| 2020 | $2,911 | $274,600 | $73,000 | $201,600 |
| 2019 | $2,705 | $260,400 | $68,300 | $192,100 |
| 2018 | $2,609 | $238,600 | $0 | $0 |
| 2017 | $2,290 | $225,700 | $0 | $0 |
| 2016 | $2,318 | $198,200 | $0 | $0 |
| 2015 | $2,224 | $198,200 | $55,500 | $142,700 |
| 2014 | -- | $168,800 | $45,000 | $123,800 |
Source: Public Records
Map
Nearby Homes
- 866 113th Ln NE
- 11501 Quincy St NE
- 961 113th Ave NE
- 11500 Monroe St NE
- 11150 Jefferson St NE
- 11119 Jefferson St NE
- 11213 Fillmore St NE
- XXX Pierce Ct NE
- 11676 Able St NE
- 612 111th Ave NE
- 11429 Pierce St NE
- 11038 Polk St NE
- 11683 Polk St NE
- 11365 Pierce St NE
- 11220 7th St NE
- 11355 6th Place NE Unit 241
- 11407 6th Place NE Unit 246
- 11419 6th Place NE Unit 249
- 137 113th Square NE Unit 204
- 11737 Able St NE
- 11361 Quincy St NE
- 11337 Quincy St NE
- 11346 Van Buren St NE
- 11373 Quincy St NE
- 11325 Quincy St NE
- 11332 Van Buren St NE
- 11348 Quincy St NE
- 11354 Van Buren St NE
- 11336 Quincy St NE
- 11360 Quincy St NE
- 11368 Van Buren St NE
- 11328 Van Buren St NE
- 11324 Quincy St NE
- 11385 Quincy St NE
- 11313 Quincy St NE
- 11372 Quincy St NE
- 11316 Van Buren St NE
- 11312 Quincy St NE
- 11400 Van Buren St NE
- 11384 Quincy St NE