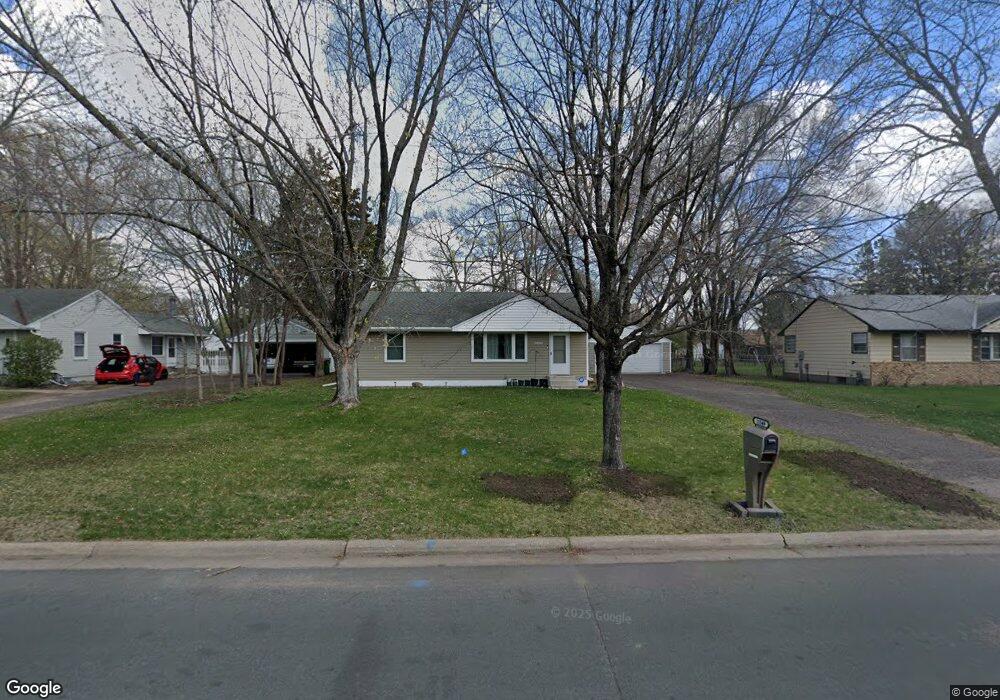
11349 Quinn St NW Coon Rapids, MN 55433
Estimated Value: $294,000 - $319,441
2
Beds
1
Bath
1,709
Sq Ft
$181/Sq Ft
Est. Value
About This Home
This home is located at 11349 Quinn St NW, Coon Rapids, MN 55433 and is currently estimated at $308,610, approximately $180 per square foot. 11349 Quinn St NW is a home located in Anoka County with nearby schools including Lucile Bruner Elementary School, Hamilton Elementary School, and Laughlin Junior/Senior High School.
Ownership History
Date
Name
Owned For
Owner Type
Purchase Details
Closed on
Feb 16, 2021
Sold by
Sph Property One Llc
Bought by
Gorman Connor Christian
Current Estimated Value
Home Financials for this Owner
Home Financials are based on the most recent Mortgage that was taken out on this home.
Original Mortgage
$258,990
Outstanding Balance
$148,911
Interest Rate
2.7%
Mortgage Type
Stand Alone Second
Estimated Equity
$159,699
Purchase Details
Closed on
Nov 6, 2020
Sold by
Bundgaard Brandon and Bundgaard Breann
Bought by
Sph Property One Llc
Purchase Details
Closed on
Sep 16, 2019
Sold by
Brannick Kelly K and Brannick Brenda K
Bought by
Bundgaard Brandon
Home Financials for this Owner
Home Financials are based on the most recent Mortgage that was taken out on this home.
Original Mortgage
$2,007,790
Interest Rate
3.5%
Mortgage Type
New Conventional
Create a Home Valuation Report for This Property
The Home Valuation Report is an in-depth analysis detailing your home's value as well as a comparison with similar homes in the area
Home Values in the Area
Average Home Value in this Area
Purchase History
| Date | Buyer | Sale Price | Title Company |
|---|---|---|---|
| Gorman Connor Christian | $267,000 | Zillow Closing Services Llc | |
| Sph Property One Llc | $246,400 | Zillow Closing Services Llc | |
| Bundgaard Brandon | $230,881 | Burnet Title | |
| Gorman Connor Connor | $246,400 | -- |
Source: Public Records
Mortgage History
| Date | Status | Borrower | Loan Amount |
|---|---|---|---|
| Open | Gorman Connor Christian | $258,990 | |
| Closed | Gorman Connor Christian | $258,990 | |
| Previous Owner | Bundgaard Brandon | $2,007,790 |
Source: Public Records
Tax History Compared to Growth
Tax History
| Year | Tax Paid | Tax Assessment Tax Assessment Total Assessment is a certain percentage of the fair market value that is determined by local assessors to be the total taxable value of land and additions on the property. | Land | Improvement |
|---|---|---|---|---|
| 2025 | $2,757 | $276,900 | $84,000 | $192,900 |
| 2024 | $2,757 | $271,400 | $87,000 | $184,400 |
| 2023 | $2,396 | $261,000 | $76,000 | $185,000 |
| 2022 | $2,219 | $251,900 | $67,000 | $184,900 |
| 2021 | $2,115 | $210,600 | $67,000 | $143,600 |
| 2020 | $1,802 | $197,600 | $62,000 | $135,600 |
| 2019 | $1,682 | $165,800 | $60,000 | $105,800 |
| 2018 | $1,625 | $152,300 | $0 | $0 |
| 2017 | $1,316 | $144,100 | $0 | $0 |
| 2016 | $1,450 | $118,100 | $0 | $0 |
| 2015 | -- | $118,100 | $45,000 | $73,100 |
| 2014 | -- | $110,500 | $36,500 | $74,000 |
Source: Public Records
Map
Nearby Homes
- 11409 Quinn St NW
- 11424 Hanson Blvd NW
- 11444 Hanson Blvd NW
- 11350 Jay St NW
- 11361 Jay St NW
- 11000 Swallow St NW
- 11036 Hanson Blvd NW Unit 20
- 11809 Zion St NW
- 2400 108th Ave NW
- 1660 Northdale Blvd NW
- 2201 108th Ave NW
- 11267 Robinson Dr NW
- 11835 Crocus St NW
- 2851 113th Ave NW
- 11749 Crooked Lake Blvd NW
- 2721 109th Ave NW
- 12019 Zion St NW
- 2728 109th Ln NW
- 2862 116th Ave NW
- 1830 121st Ln NW Unit 611
- 11401 Quinn St NW
- 11341 Quinn St NW
- 11333 Quinn St NW
- 11348 Quinn St NW
- 11348 Partridge St NW
- 11400 Quinn St NW
- 11340 Quinn St NW
- 11400 Partridge St NW
- 11340 Partridge St NW
- 11408 Quinn St NW
- 11417 Quinn St NW
- 11332 Quinn St NW
- 11325 Quinn St NW
- 11332 Partridge St NW
- 11408 Partridge St NW
- 11324 Quinn St NW
- 11416 Quinn St NW
- 11324 Partridge St NW
- 11425 Quinn St NW
- 11317 Quinn St NW