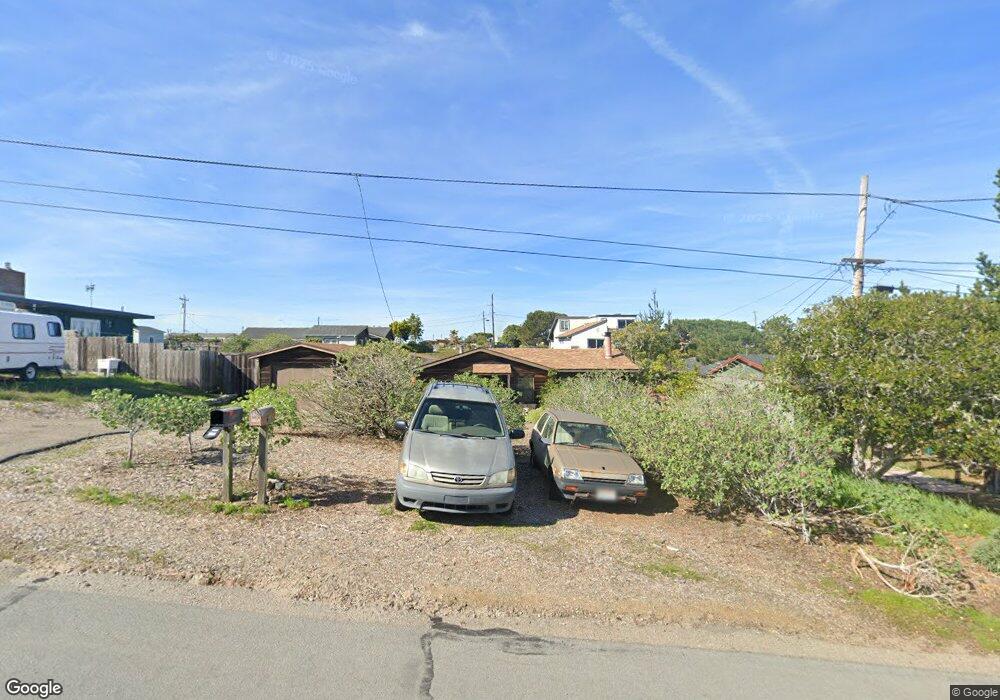
1135 3rd St Los Osos, CA 93402
Estimated Value: $663,222 - $823,000
2
Beds
1
Bath
691
Sq Ft
$1,058/Sq Ft
Est. Value
About This Home
This home is located at 1135 3rd St, Los Osos, CA 93402 and is currently estimated at $730,806, approximately $1,057 per square foot. 1135 3rd St is a home located in San Luis Obispo County with nearby schools including Baywood Elementary School, Los Osos Middle School, and Morro Bay High School.
Ownership History
Date
Name
Owned For
Owner Type
Purchase Details
Closed on
Sep 16, 2024
Sold by
Delma Quan Survivors Trust and Quan Cary
Bought by
Stacy Quan Trust and Quan
Current Estimated Value
Purchase Details
Closed on
Aug 16, 2017
Sold by
Quan Delma and The William & Delma Quan Famil
Bought by
Quan Delma and The Delma Quan Survivor S Trus
Create a Home Valuation Report for This Property
The Home Valuation Report is an in-depth analysis detailing your home's value as well as a comparison with similar homes in the area
Home Values in the Area
Average Home Value in this Area
Purchase History
| Date | Buyer | Sale Price | Title Company |
|---|---|---|---|
| Stacy Quan Trust | -- | None Listed On Document | |
| Stacy Quan Trust | -- | None Listed On Document | |
| Quan Delma | -- | None Available |
Source: Public Records
Tax History
| Year | Tax Paid | Tax Assessment Tax Assessment Total Assessment is a certain percentage of the fair market value that is determined by local assessors to be the total taxable value of land and additions on the property. | Land | Improvement |
|---|---|---|---|---|
| 2025 | $4,180 | $637,500 | $484,500 | $153,000 |
| 2024 | $4,167 | $153,754 | $82,629 | $71,125 |
| 2023 | $4,167 | $150,740 | $81,009 | $69,731 |
| 2022 | $4,023 | $147,785 | $79,421 | $68,364 |
| 2021 | $3,892 | $144,888 | $77,864 | $67,024 |
| 2020 | $3,641 | $143,403 | $77,066 | $66,337 |
| 2019 | $3,621 | $140,592 | $75,555 | $65,037 |
| 2018 | $3,572 | $137,836 | $74,074 | $63,762 |
| 2017 | $3,575 | $135,134 | $72,622 | $62,512 |
| 2016 | $2,468 | $132,486 | $71,199 | $61,287 |
| 2015 | $2,446 | $130,497 | $70,130 | $60,367 |
| 2014 | $2,320 | $127,942 | $68,757 | $59,185 |
Source: Public Records
Map
Nearby Homes
- 1247 3rd St
- 1107 Pasadena Dr
- 0 Pasadena Dr Unit SC26007383
- 0 Pasadena Dr Unit 226009679
- 0 Pasadena Dr Unit 18798331
- 768 El Morro Ave
- 914 El Morro Ave
- 1420 5th St
- 1412 5th St
- 1168 10th St
- 1540 7th St
- 1140 12th St
- 1527 11th St
- 1421 13th St
- 1705 5th St
- 1565 11th St
- 1701 8th St
- 1455 13th St
- 1231 10th St
- 1266 10th St
Your Personal Tour Guide
Ask me questions while you tour the home.