Estimated Value: $279,962 - $296,000
2
Beds
3
Baths
1,398
Sq Ft
$206/Sq Ft
Est. Value
About This Home
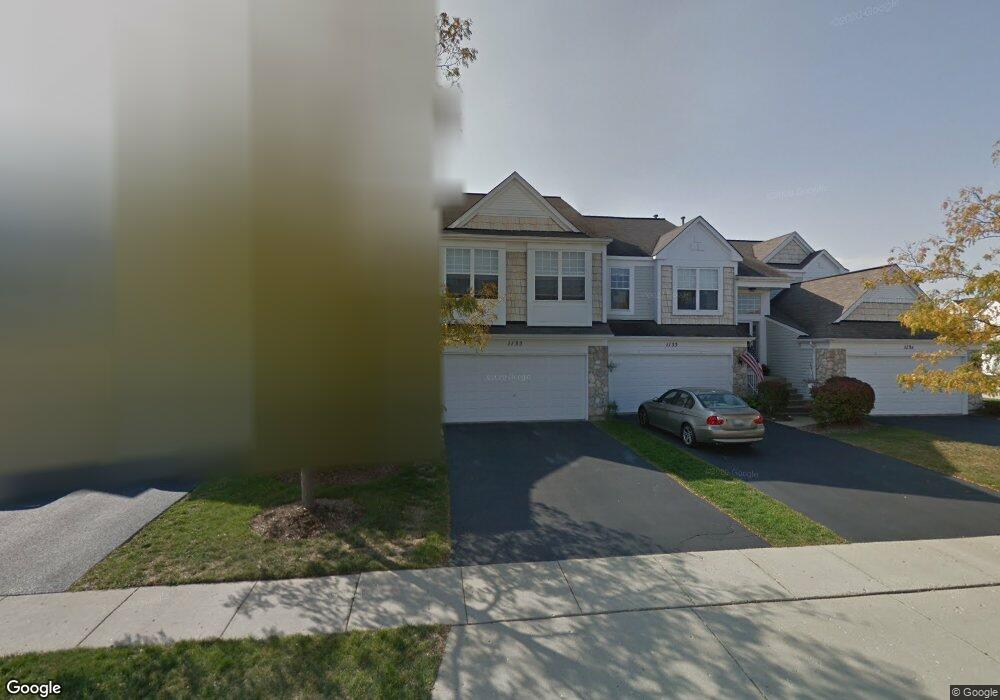
This home is located at 1135 Delta Ct Unit 243C, Elgin, IL 60123 and is currently estimated at $287,991, approximately $206 per square foot. 1135 Delta Ct Unit 243C is a home located in Kane County with nearby schools including Fox Meadow Elementary School, Kenyon Woods Middle School, and South Elgin High School.
Ownership History
Date
Name
Owned For
Owner Type
Purchase Details
Closed on
Mar 13, 2007
Sold by
Lemberis Thomas J and Marinakos Kathy
Bought by
Storey Michael R and Hopkins Katherine L
Current Estimated Value
Home Financials for this Owner
Home Financials are based on the most recent Mortgage that was taken out on this home.
Original Mortgage
$168,300
Outstanding Balance
$101,925
Interest Rate
6.27%
Mortgage Type
Purchase Money Mortgage
Estimated Equity
$186,066
Purchase Details
Closed on
Dec 11, 1998
Sold by
Pulte Home Corp
Bought by
Lemberis Thomas J and Marinakos Kathy
Home Financials for this Owner
Home Financials are based on the most recent Mortgage that was taken out on this home.
Original Mortgage
$121,150
Interest Rate
6.76%
Mortgage Type
FHA
Create a Home Valuation Report for This Property
The Home Valuation Report is an in-depth analysis detailing your home's value as well as a comparison with similar homes in the area
Home Values in the Area
Average Home Value in this Area
Purchase History
| Date | Buyer | Sale Price | Title Company |
|---|---|---|---|
| Storey Michael R | $187,000 | Chicago Title Insurance Co | |
| Lemberis Thomas J | $127,000 | First American Title Ins Co |
Source: Public Records
Mortgage History
| Date | Status | Borrower | Loan Amount |
|---|---|---|---|
| Open | Storey Michael R | $168,300 | |
| Previous Owner | Lemberis Thomas J | $121,150 |
Source: Public Records
Tax History
| Year | Tax Paid | Tax Assessment Tax Assessment Total Assessment is a certain percentage of the fair market value that is determined by local assessors to be the total taxable value of land and additions on the property. | Land | Improvement |
|---|---|---|---|---|
| 2024 | $4,955 | $70,501 | $16,550 | $53,951 |
| 2023 | $4,703 | $63,693 | $14,952 | $48,741 |
| 2022 | $4,474 | $58,077 | $13,634 | $44,443 |
| 2021 | $4,269 | $53,848 | $12,747 | $41,101 |
| 2020 | $4,141 | $51,406 | $12,169 | $39,237 |
| 2019 | $4,013 | $48,968 | $11,592 | $37,376 |
| 2018 | $3,968 | $46,131 | $10,920 | $35,211 |
| 2017 | $3,868 | $43,610 | $10,323 | $33,287 |
| 2016 | $3,675 | $40,458 | $9,577 | $30,881 |
| 2015 | -- | $37,083 | $8,778 | $28,305 |
| 2014 | -- | $32,564 | $8,670 | $23,894 |
| 2013 | -- | $33,423 | $8,899 | $24,524 |
Source: Public Records
Map
Nearby Homes
- 1141 Delta Ct Unit 255E
- 2350 Camden Bay Unit 176A
- 1011 Reserve Dr
- 27 Frederick Ct
- 2659 Venetian Ln
- 2595 Venetian Ln
- 2594 Venetian Ln
- 1410 Misthaven Ln
- 2545 Edgewater Dr
- 522 Lowell Dr Unit 2
- 2156 Sandpiper Way
- 1784 College Green Dr
- 647 Tuscan View
- 1780 College Green Dr Unit 7
- 1283 Sandhurst Ln Unit 2
- 1705 College Green Dr Unit 2
- 611 Woodbridge Dr
- 1782 Pebble Beach Cir
- 1247 Sandhurst Ln Unit 4
- 671 Fieldcrest Dr
- 1137 Delta Ct Unit 242D
- 1139 Delta Ct Unit 241D
- 1133 Delta Ct Unit 244B
- 1133 Delta Ct Unit 1
- 1131 Delta Ct Unit 245A
- 1130 Delta Ct Unit 291E
- 1132 Delta Ct Unit 292D
- 1134 Delta Ct Unit 293D
- 1138 Delta Ct Unit 295A
- 1136 Delta Ct Unit 294B
- 1136 Delta Ct Unit 1136
- 1138 Delta Ct Unit 1138
- 1140 Delta Ct Unit 218A
- 1142 Delta Ct Unit 282B
- 1147 Delta Ct Unit 252B
- 1149 Delta Ct Unit 251A
- 1143 Delta Ct Unit 254D
- 1175 Delta Dr Unit 233B
- 1177 Delta Dr Unit 234A
- 1173 Delta Dr Unit 232B