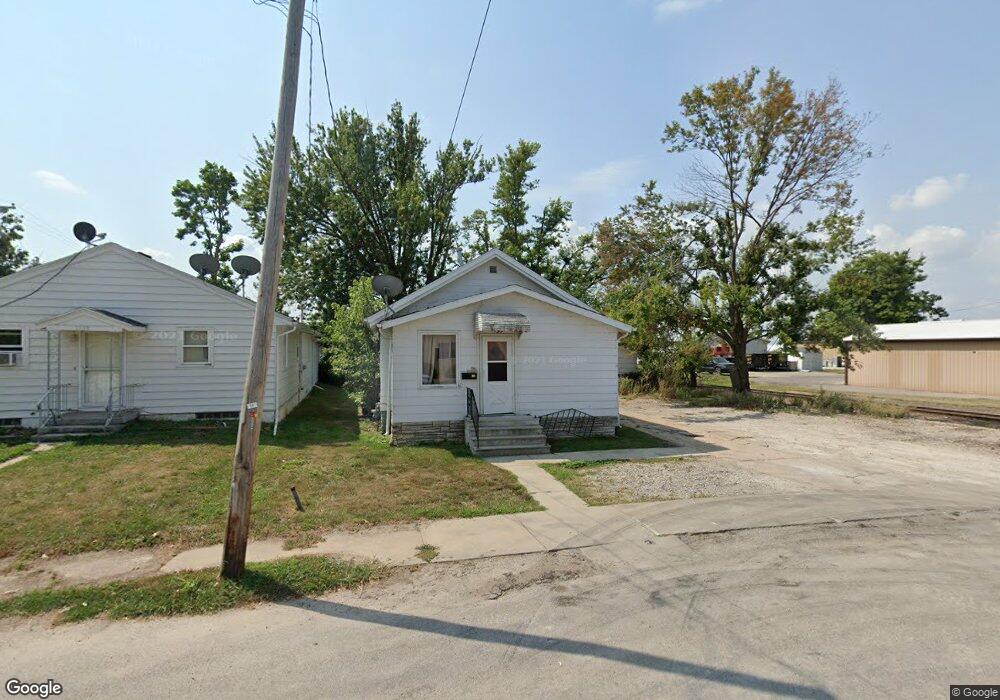
1135 Hubbard Ave NE Cedar Rapids, IA 52402
Mound View NeighborhoodEstimated Value: $124,000 - $140,000
3
Beds
1
Bath
946
Sq Ft
$137/Sq Ft
Est. Value
About This Home
This home is located at 1135 Hubbard Ave NE, Cedar Rapids, IA 52402 and is currently estimated at $129,515, approximately $136 per square foot. 1135 Hubbard Ave NE is a home located in Linn County with nearby schools including Garfield Elementary School, Franklin Middle School, and George Washington High School.
Ownership History
Date
Name
Owned For
Owner Type
Purchase Details
Closed on
May 20, 2011
Sold by
Willson Zachary J and Ransier Logan M
Bought by
Engineered Seal Products Inc
Current Estimated Value
Purchase Details
Closed on
Dec 14, 2006
Sold by
Pettit Ronald D and Pettit Kerrie J
Bought by
Willson Zachary J and Ransier Logan M
Home Financials for this Owner
Home Financials are based on the most recent Mortgage that was taken out on this home.
Original Mortgage
$81,500
Interest Rate
6.33%
Mortgage Type
Purchase Money Mortgage
Purchase Details
Closed on
Feb 28, 2003
Sold by
Santee James Arthur and Santee James Arthur
Bought by
Pettit Ronald D
Home Financials for this Owner
Home Financials are based on the most recent Mortgage that was taken out on this home.
Original Mortgage
$56,000
Interest Rate
5.96%
Create a Home Valuation Report for This Property
The Home Valuation Report is an in-depth analysis detailing your home's value as well as a comparison with similar homes in the area
Home Values in the Area
Average Home Value in this Area
Purchase History
| Date | Buyer | Sale Price | Title Company |
|---|---|---|---|
| Engineered Seal Products Inc | $83,000 | None Available | |
| Willson Zachary J | $81,000 | None Available | |
| Pettit Ronald D | $69,500 | -- |
Source: Public Records
Mortgage History
| Date | Status | Borrower | Loan Amount |
|---|---|---|---|
| Previous Owner | Willson Zachary J | $81,500 | |
| Previous Owner | Pettit Ronald D | $56,000 |
Source: Public Records
Tax History Compared to Growth
Tax History
| Year | Tax Paid | Tax Assessment Tax Assessment Total Assessment is a certain percentage of the fair market value that is determined by local assessors to be the total taxable value of land and additions on the property. | Land | Improvement |
|---|---|---|---|---|
| 2025 | $1,942 | $116,900 | $23,500 | $93,400 |
| 2024 | $1,964 | $109,700 | $21,200 | $88,500 |
| 2023 | $1,964 | $109,700 | $21,200 | $88,500 |
| 2022 | $1,734 | $93,100 | $20,000 | $73,100 |
| 2021 | $1,862 | $83,700 | $16,500 | $67,200 |
| 2020 | $1,862 | $84,400 | $16,500 | $67,900 |
| 2019 | $1,772 | $82,200 | $16,500 | $65,700 |
| 2018 | $1,722 | $82,200 | $16,500 | $65,700 |
| 2017 | $1,592 | $72,300 | $16,500 | $55,800 |
| 2016 | $1,592 | $74,900 | $16,500 | $58,400 |
| 2015 | $1,638 | $77,005 | $16,479 | $60,526 |
| 2014 | $1,638 | $81,131 | $16,479 | $64,652 |
| 2013 | $1,690 | $81,131 | $16,479 | $64,652 |
Source: Public Records
Map
Nearby Homes
- 1046 12th St NE
- 1311 I Ave NE
- 2011 Sierra Cir NE
- 2000 Sierra Cir NE
- 2015 Sierra Cir NE
- 2006 Sierra Cir NE
- 2019 Sierra Cir NE
- 2012 Sierra Cir NE
- 2023 Sierra Cir NE
- 2018 Sierra Cir NE
- 2103 Sierra Cir NE
- 2109 Sierra Cir NE
- 2102 Sierra Cir NE
- 2115 Sierra Cir NE
- 2110 Sierra Cir NE
- 2116 Sierra Cir NE
- 2121 Sierra Cir NE
- 2127 Sierra Cir NE
- 2122 Sierra Cir NE
- 2201 Sierra Cir NE
- 1139 Hubbard Ave NE
- 1125 Hubbard Ave NE
- 1132 I Ave NE
- 1117 Hubbard Ave NE
- 1128 I Ave NE
- 1027 12th St NE
- 1023 12th St NE
- 1136 I Ave NE
- 1031 12th St NE
- 1120 I Ave NE Unit A
- 1017 12th St NE
- 1011 12th St NE
- 1037 12th St NE
- 1026 11th St NE
- 1014 11th St NE
- 1148 I Ave NE
- 1148 I Ave NE Unit NE
- 1049 12th St NE
- 1004 11th St NE
- 1036 11th St NE