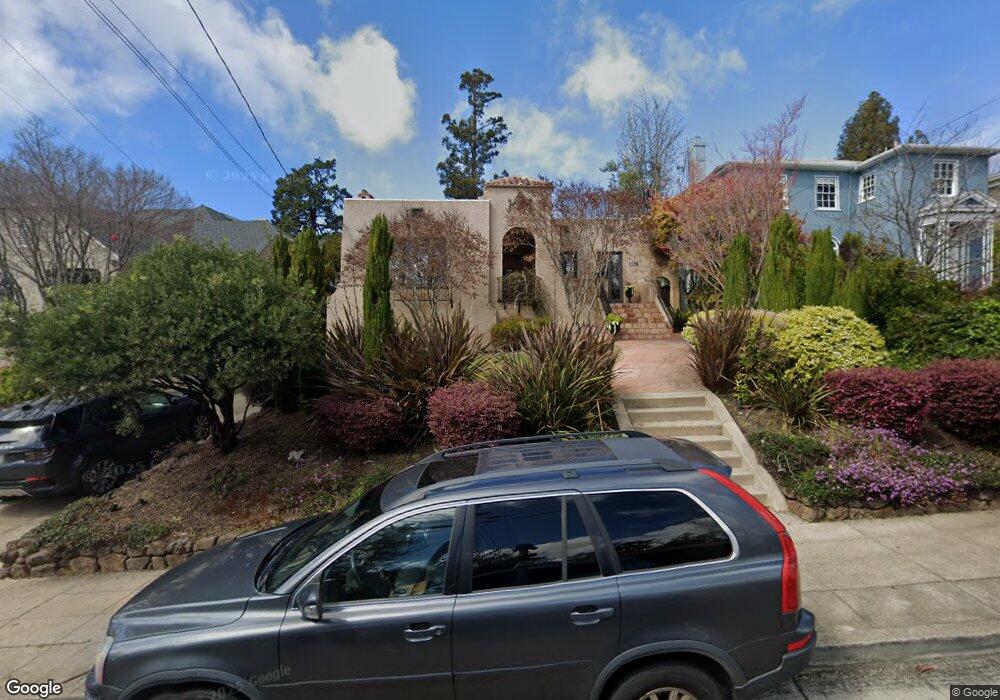
1136 Clarendon Crescent Oakland, CA 94610
Crocker Highlands NeighborhoodEstimated Value: $1,793,533 - $2,367,000
4
Beds
3
Baths
2,319
Sq Ft
$881/Sq Ft
Est. Value
About This Home
This home is located at 1136 Clarendon Crescent, Oakland, CA 94610 and is currently estimated at $2,043,383, approximately $881 per square foot. 1136 Clarendon Crescent is a home located in Alameda County with nearby schools including Crocker Highlands Elementary School, Edna Brewer Middle School, and Oakland High School.
Ownership History
Date
Name
Owned For
Owner Type
Purchase Details
Closed on
Dec 14, 2010
Sold by
Jow Yung Li Lily and Evans Lawrence C
Bought by
Baenen Melissa S and Baenen Douglas M
Current Estimated Value
Home Financials for this Owner
Home Financials are based on the most recent Mortgage that was taken out on this home.
Original Mortgage
$729,000
Outstanding Balance
$481,391
Interest Rate
4.21%
Mortgage Type
New Conventional
Estimated Equity
$1,561,992
Purchase Details
Closed on
Sep 8, 2006
Sold by
Hackett Kenneth Michael and The Hackett Family 2001 Living
Bought by
Jow Yung Li Lily and Evans Lawrence C
Home Financials for this Owner
Home Financials are based on the most recent Mortgage that was taken out on this home.
Original Mortgage
$640,800
Interest Rate
6.25%
Mortgage Type
Purchase Money Mortgage
Purchase Details
Closed on
Dec 18, 2001
Sold by
Hackett Kenneth M and Hackett Margaret H
Bought by
Hackett Kenneth Michael and The Hackett Family 2001 Living
Create a Home Valuation Report for This Property
The Home Valuation Report is an in-depth analysis detailing your home's value as well as a comparison with similar homes in the area
Home Values in the Area
Average Home Value in this Area
Purchase History
| Date | Buyer | Sale Price | Title Company |
|---|---|---|---|
| Baenen Melissa S | $1,100,000 | Fidelity National Title Co | |
| Jow Yung Li Lily | $801,000 | Fidelity National Title Co | |
| Hackett Kenneth Michael | -- | -- |
Source: Public Records
Mortgage History
| Date | Status | Borrower | Loan Amount |
|---|---|---|---|
| Open | Baenen Melissa S | $729,000 | |
| Previous Owner | Jow Yung Li Lily | $640,800 |
Source: Public Records
Tax History Compared to Growth
Tax History
| Year | Tax Paid | Tax Assessment Tax Assessment Total Assessment is a certain percentage of the fair market value that is determined by local assessors to be the total taxable value of land and additions on the property. | Land | Improvement |
|---|---|---|---|---|
| 2025 | $19,343 | $1,409,210 | $422,763 | $986,447 |
| 2024 | $19,343 | $1,381,588 | $414,476 | $967,112 |
| 2023 | $20,460 | $1,354,506 | $406,352 | $948,154 |
| 2022 | $20,148 | $1,327,952 | $398,385 | $929,567 |
| 2021 | $19,496 | $1,301,915 | $390,574 | $911,341 |
| 2020 | $19,164 | $1,288,572 | $386,571 | $902,001 |
| 2019 | $18,588 | $1,263,316 | $378,995 | $884,321 |
| 2018 | $18,196 | $1,238,555 | $371,566 | $866,989 |
| 2017 | $17,556 | $1,214,278 | $364,283 | $849,995 |
| 2016 | $17,114 | $1,190,474 | $357,142 | $833,332 |
| 2015 | $17,031 | $1,172,600 | $351,780 | $820,820 |
| 2014 | $17,373 | $1,149,631 | $344,889 | $804,742 |
Source: Public Records
Map
Nearby Homes
- 1297 Sunnyhills Rd
- 1063 Clarendon Crescent
- 22 Valant Place
- 62 Farragut Ave
- 542 Midcrest Rd
- 44 Farragut Ave
- 191 Indian Rd
- 1462 Trestle Glen Rd
- 1006 Glendora Ave
- 1107 Wellington St
- 1002 Everett Ave
- 187 Saint James Dr
- 1415 Trestle Glen Rd
- 2 Cavendish Ln
- 4606 San Sebastian Ave
- 725 Carlston Ave
- 1124 Hollywood Ave Unit 3
- 4426 Park Blvd
- 369 Hampton Rd
- 1130 Clarendon Crescent
- 1142 Clarendon Crescent
- 1124 Clarendon Crescent
- 1152 Clarendon Crescent
- 1118 Clarendon Crescent
- 1129 Mandana Blvd
- 1137 Mandana Blvd
- 1156 Clarendon Crescent
- 1112 Clarendon Crescent
- 1121 Mandana Blvd
- 1135 Clarendon Crescent
- 1129 Clarendon Crescent
- 1123 Clarendon Crescent
- 1141 Clarendon Crescent
- 1147 Clarendon Crescent
- 1155 Mandana Blvd
- 1119 Clarendon Crescent
- 1115 Clarendon Crescent
- 1166 Clarendon Crescent
- 1100 Clarendon Crescent