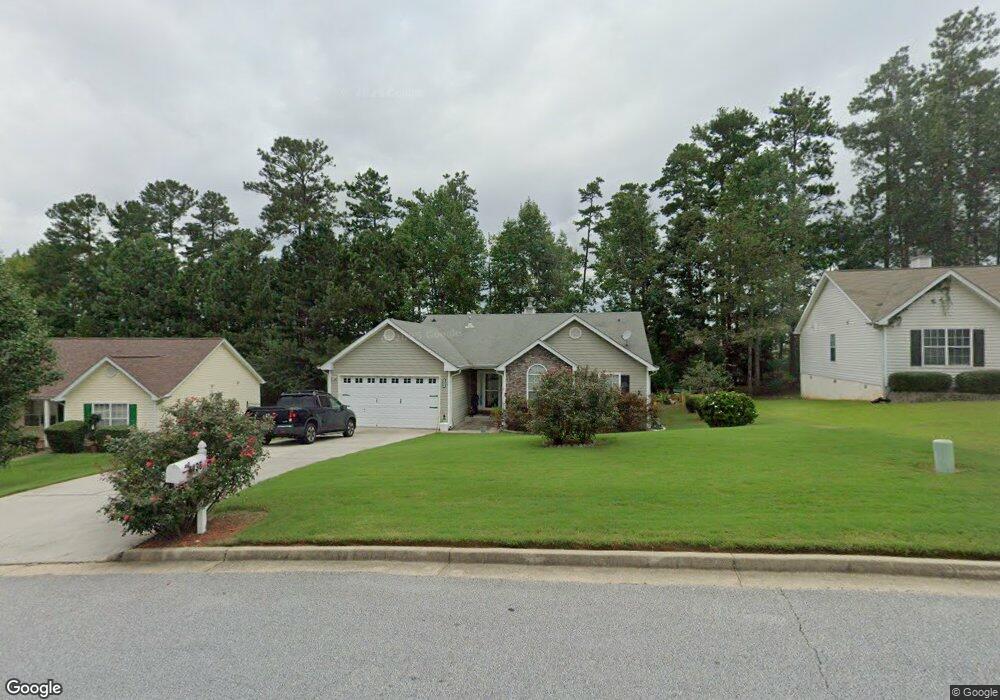
1136 Commons Ct Unit 2 Jonesboro, GA 30238
Estimated Value: $232,000 - $237,663
3
Beds
2
Baths
1,405
Sq Ft
$167/Sq Ft
Est. Value
About This Home
This home is located at 1136 Commons Ct Unit 2, Jonesboro, GA 30238 and is currently estimated at $235,166, approximately $167 per square foot. 1136 Commons Ct Unit 2 is a home located in Clayton County with nearby schools including Kemp Primary School, Kemp Elementary School, and Mundys Mill Middle School.
Ownership History
Date
Name
Owned For
Owner Type
Purchase Details
Closed on
Mar 1, 2004
Sold by
Bayne Travis J
Bought by
Turner Valerie P
Current Estimated Value
Home Financials for this Owner
Home Financials are based on the most recent Mortgage that was taken out on this home.
Original Mortgage
$129,800
Interest Rate
5.38%
Mortgage Type
VA
Purchase Details
Closed on
Apr 24, 2003
Sold by
Bayne Travis J
Bought by
Bayne Travis J
Home Financials for this Owner
Home Financials are based on the most recent Mortgage that was taken out on this home.
Original Mortgage
$119,000
Interest Rate
4.75%
Mortgage Type
Stand Alone Second
Purchase Details
Closed on
May 31, 2001
Sold by
Peachtree Homes Inc
Bought by
Bayne Travis J
Home Financials for this Owner
Home Financials are based on the most recent Mortgage that was taken out on this home.
Original Mortgage
$115,400
Interest Rate
7.14%
Mortgage Type
FHA
Create a Home Valuation Report for This Property
The Home Valuation Report is an in-depth analysis detailing your home's value as well as a comparison with similar homes in the area
Home Values in the Area
Average Home Value in this Area
Purchase History
| Date | Buyer | Sale Price | Title Company |
|---|---|---|---|
| Turner Valerie P | $131,000 | -- | |
| Bayne Travis J | -- | -- | |
| Bayne Travis J | $116,400 | -- |
Source: Public Records
Mortgage History
| Date | Status | Borrower | Loan Amount |
|---|---|---|---|
| Previous Owner | Turner Valerie P | $129,800 | |
| Previous Owner | Bayne Travis J | $119,000 | |
| Previous Owner | Bayne Travis J | $115,400 |
Source: Public Records
Tax History Compared to Growth
Tax History
| Year | Tax Paid | Tax Assessment Tax Assessment Total Assessment is a certain percentage of the fair market value that is determined by local assessors to be the total taxable value of land and additions on the property. | Land | Improvement |
|---|---|---|---|---|
| 2024 | $3,172 | $90,400 | $8,000 | $82,400 |
| 2023 | $2,429 | $82,520 | $8,000 | $74,520 |
| 2022 | $2,283 | $67,280 | $8,000 | $59,280 |
| 2021 | $1,803 | $54,760 | $8,000 | $46,760 |
| 2020 | $1,703 | $51,717 | $8,000 | $43,717 |
| 2019 | $1,503 | $46,166 | $7,200 | $38,966 |
| 2018 | $1,345 | $42,276 | $7,200 | $35,076 |
| 2017 | $1,031 | $34,487 | $7,200 | $27,287 |
| 2016 | $885 | $30,900 | $7,200 | $23,700 |
| 2015 | $1,009 | $0 | $0 | $0 |
| 2014 | $1,037 | $36,059 | $7,200 | $28,859 |
Source: Public Records
Map
Nearby Homes
- 1091 Commons Ct Unit 2
- 1172 Faulkner Way
- 10200 Commons Crossing Unit 1
- 1253 Todiway Ct
- 10197 Hamilton Glen
- 1036 Walnut Creek Ln
- 1296 Todiway Ct
- 9997 Point View Dr
- 10085 Brass Ring Rd
- 10065 Brass Ring Rd
- 1147 Dunivin Dr
- 1241 Larkwood Dr
- 10283 Richfield Ct
- 1352 Labelle St
- 10410 Iron Gate Ln
- 1159 Bonita Way Unit 10
- 10248 Briarbay Loop
- 1157 Mundys Mill Rd
- 1131 Orr Rd
- 1224 Bonita Cir
- 1142 Commons Ct
- 1130 Commons Ct Unit 2
- 10149 Cormac St Unit 172 - WESTIN
- 10155 Cormac St
- 1150 Commons Ct
- 10161 Cormac St
- 10422 Commons Crossing Unit 2
- 1129 Commons Ct
- 10137 Cormac St Unit 170 - EVEREST III
- 10143 Cormac St Unit 171 - ISABELLLA I
- 1139 Commons Ct
- 10167 Cormac St Unit 175
- 10414 Commons Crossing
- 1158 Commons Ct
- 1121 Commons Ct Unit 2
- 0 Commons Crossing Unit 8703775
- 0 Commons Crossing Unit 8723784
- 0 Commons Crossing Unit 8794063
- 0 Commons Crossing Unit 3187485
- 0 Commons Crossing Unit 3289723