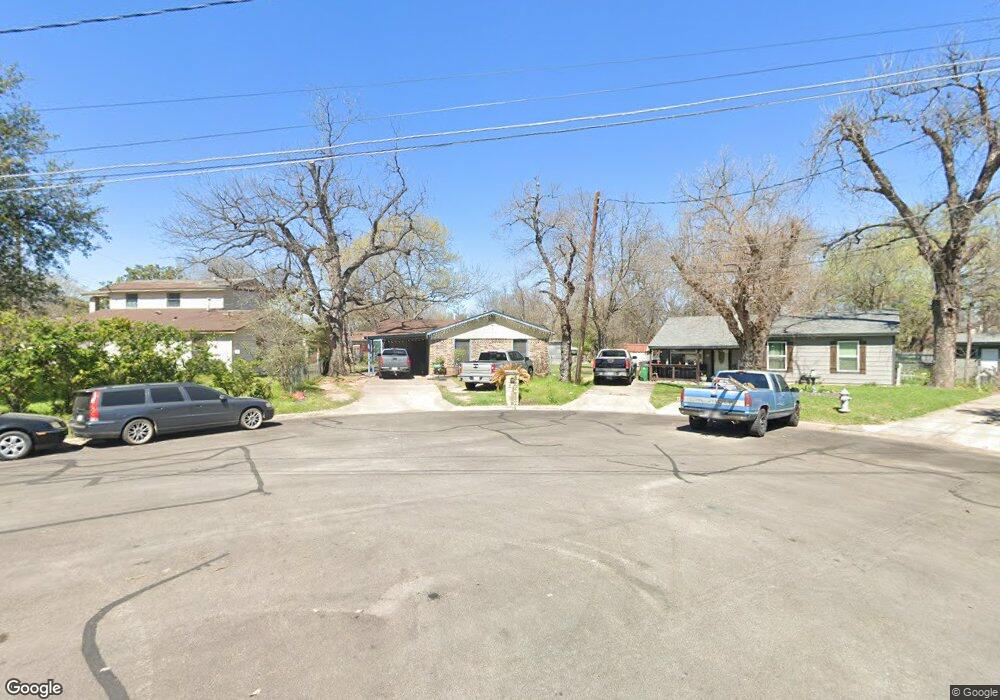
1136 Map Cir Unit C Austin, TX 78721
East MLK NeighborhoodEstimated Value: $391,000 - $430,000
3
Beds
2
Baths
1,118
Sq Ft
$369/Sq Ft
Est. Value
About This Home
This home is located at 1136 Map Cir Unit C, Austin, TX 78721 and is currently estimated at $412,544, approximately $369 per square foot. 1136 Map Cir Unit C is a home located in Travis County with nearby schools including Govalle Elementary School, Martin Middle School, and Eastside Early College High School.
Ownership History
Date
Name
Owned For
Owner Type
Purchase Details
Closed on
Mar 16, 2020
Sold by
Padron Jose G and Salazar Rosalva
Bought by
Salazar Rosalva
Current Estimated Value
Home Financials for this Owner
Home Financials are based on the most recent Mortgage that was taken out on this home.
Original Mortgage
$27,150
Outstanding Balance
$13,362
Interest Rate
3.4%
Mortgage Type
New Conventional
Estimated Equity
$399,182
Purchase Details
Closed on
Nov 25, 1998
Sold by
Shiek Diana V and Vasquez Christina
Bought by
Padron Jose G and Salazar Rosalva
Home Financials for this Owner
Home Financials are based on the most recent Mortgage that was taken out on this home.
Original Mortgage
$62,372
Interest Rate
6.69%
Mortgage Type
FHA
Purchase Details
Closed on
Mar 30, 1996
Sold by
Loredo Victoria Vasquez
Bought by
Shiek Diana V and Pina Sylvia V
Create a Home Valuation Report for This Property
The Home Valuation Report is an in-depth analysis detailing your home's value as well as a comparison with similar homes in the area
Home Values in the Area
Average Home Value in this Area
Purchase History
| Date | Buyer | Sale Price | Title Company |
|---|---|---|---|
| Salazar Rosalva | -- | Servicelink | |
| Padron Jose G | -- | Alamo Title Company | |
| Shiek Diana V | -- | -- |
Source: Public Records
Mortgage History
| Date | Status | Borrower | Loan Amount |
|---|---|---|---|
| Open | Salazar Rosalva | $27,150 | |
| Closed | Padron Jose G | $62,372 | |
| Closed | Padron Jose G | $3,000 |
Source: Public Records
Tax History
| Year | Tax Paid | Tax Assessment Tax Assessment Total Assessment is a certain percentage of the fair market value that is determined by local assessors to be the total taxable value of land and additions on the property. | Land | Improvement |
|---|---|---|---|---|
| 2025 | $6,119 | $402,615 | -- | -- |
| 2023 | $4,951 | $560,500 | $330,000 | $230,500 |
| 2022 | $10,666 | $540,093 | $330,000 | $210,093 |
| 2021 | $8,269 | $379,902 | $192,500 | $187,402 |
| 2020 | $5,717 | $266,558 | $192,500 | $74,058 |
| 2018 | $4,953 | $223,711 | $192,500 | $92,319 |
| 2017 | $4,536 | $203,374 | $154,000 | $102,047 |
| 2016 | $4,123 | $184,885 | $82,500 | $115,935 |
| 2015 | $3,270 | $168,077 | $82,500 | $98,238 |
| 2014 | $3,270 | $152,797 | $0 | $0 |
Source: Public Records
Map
Nearby Homes
- 4604 Munson St
- 4602 Alf Ave Unit B
- 4608 Prock Ln
- 4801 Sara Dr Unit B
- 4810 Alf Ave
- 3611 Munson St
- 3613 Munson St
- 3614 Abbate Cir Unit A
- 1118 Spur St Unit D
- 1124 Spur St
- 1127 Mark St Unit D
- 1135 Saucedo St
- 1125 Saucedo St Unit 2
- 1130 Spur St Unit A
- 3600 Oak Springs Dr
- 5006 Sara Dr
- 3503 Kay St Unit 2
- 1103 Saucedo St Unit 2
- 1149 Ebert Ave Unit D
- 1114 Richardine Ave
- 1138 Map Cir Unit C
- 4606 Munson St
- 4608 Munson St
- 1137 Map Cir Unit C
- 4611 Prock Ln
- 4701 Prock Ln
- 4602 Munson St
- 4609 Prock Ln
- 4705 Prock Ln
- 1135 Map Cir Unit C
- 1133 Map Cir Unit C
- 4707 Prock Ln
- 1043 Springdale Rd
- 4609 Munson St
- 4611 Munson St
- 4607 Munson St
- 4613 Munson St
- 4600 Munson St
- 1047 Springdale Rd
- 4605 Munson St
Your Personal Tour Guide
Ask me questions while you tour the home.