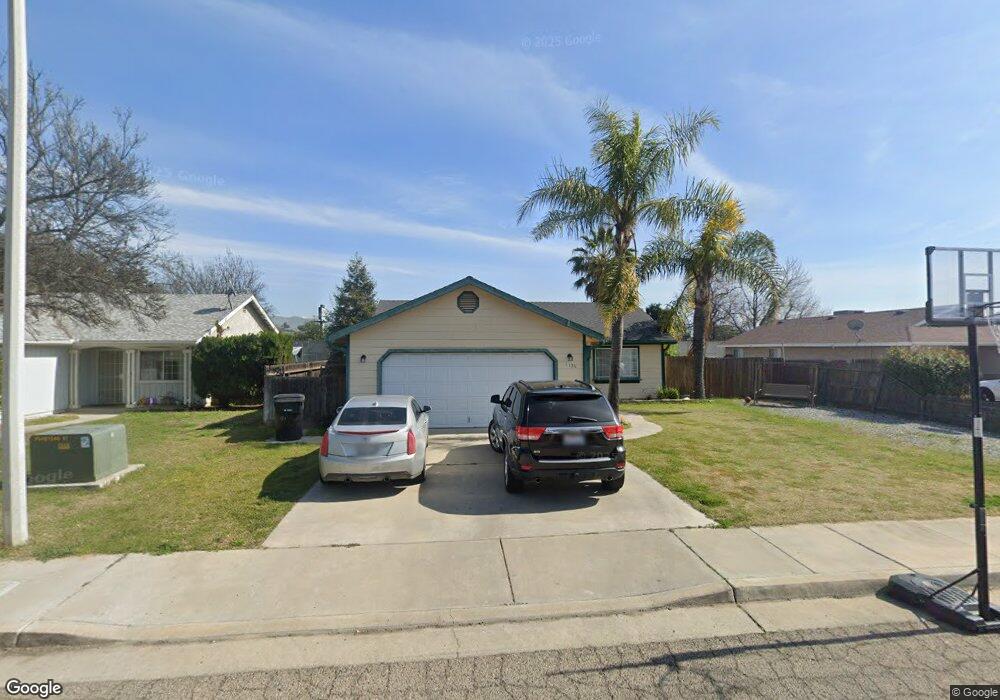
1136 San Carlos St Porterville, CA 93257
Porterville Northwest NeighborhoodEstimated Value: $299,680 - $328,000
3
Beds
2
Baths
1,219
Sq Ft
$263/Sq Ft
Est. Value
About This Home
This home is located at 1136 San Carlos St, Porterville, CA 93257 and is currently estimated at $320,170, approximately $262 per square foot. 1136 San Carlos St is a home located in Tulare County with nearby schools including Westfield Elementary School, Sequoia Middle School, and Monache High School.
Ownership History
Date
Name
Owned For
Owner Type
Purchase Details
Closed on
Feb 24, 2017
Sold by
Ferris Andrew B and Bouzek Cheryll A
Bought by
Ferris Andrew B
Current Estimated Value
Home Financials for this Owner
Home Financials are based on the most recent Mortgage that was taken out on this home.
Original Mortgage
$53,600
Outstanding Balance
$27,419
Interest Rate
4.23%
Mortgage Type
New Conventional
Estimated Equity
$292,751
Purchase Details
Closed on
Jul 27, 2000
Sold by
Harris Wayne F and Harris Janette A
Bought by
Ferris Andrew B and Ferris Cheryll A
Home Financials for this Owner
Home Financials are based on the most recent Mortgage that was taken out on this home.
Original Mortgage
$20,000
Interest Rate
8.13%
Mortgage Type
Seller Take Back
Purchase Details
Closed on
Oct 26, 1999
Sold by
Scott Harry E and Scott Dorla R
Bought by
Harris Wayne F and Harris Janette A
Create a Home Valuation Report for This Property
The Home Valuation Report is an in-depth analysis detailing your home's value as well as a comparison with similar homes in the area
Home Values in the Area
Average Home Value in this Area
Purchase History
| Date | Buyer | Sale Price | Title Company |
|---|---|---|---|
| Ferris Andrew B | -- | First American Title Ins Co | |
| Ferris Andrew B | $20,000 | Cuesta Title Company | |
| Harris Wayne F | -- | -- |
Source: Public Records
Mortgage History
| Date | Status | Borrower | Loan Amount |
|---|---|---|---|
| Open | Ferris Andrew B | $53,600 | |
| Closed | Ferris Andrew B | $20,000 | |
| Closed | Ferris Andrew B | $51,000 |
Source: Public Records
Tax History Compared to Growth
Tax History
| Year | Tax Paid | Tax Assessment Tax Assessment Total Assessment is a certain percentage of the fair market value that is determined by local assessors to be the total taxable value of land and additions on the property. | Land | Improvement |
|---|---|---|---|---|
| 2025 | $1,438 | $131,846 | $30,135 | $101,711 |
| 2024 | $1,438 | $129,262 | $29,545 | $99,717 |
| 2023 | $1,436 | $126,728 | $28,966 | $97,762 |
| 2022 | $1,836 | $157,818 | $36,073 | $121,745 |
| 2021 | $1,780 | $154,724 | $35,366 | $119,358 |
| 2020 | $1,762 | $153,137 | $35,003 | $118,134 |
| 2019 | $1,731 | $150,135 | $34,317 | $115,818 |
| 2018 | $1,702 | $147,191 | $33,644 | $113,547 |
| 2017 | $1,325 | $113,609 | $25,967 | $87,642 |
| 2016 | $1,197 | $111,382 | $25,458 | $85,924 |
| 2015 | -- | $109,709 | $25,076 | $84,633 |
| 2014 | -- | $107,560 | $24,585 | $82,975 |
Source: Public Records
Map
Nearby Homes
- 1045 N Westside St
- 1089 Pioneer Ave
- 829 Pioneer Ave
- 680 W Gerry Cir
- 793 Pioneer Ave
- 681 W Mulberry Ave
- 927 Shadowood Place
- 1245 Atkins St
- 701 W Theta Ave
- 701 Theta Ave
- 1076 N Beverly St
- 700 N Prospect St
- 1370 Lindale Place
- 640 N Prospect St
- 1121 N Lindale Way
- 816 W Grand Ave
- 1421 Pamela Cir
- 824 W Grand Ave
- 1450 W Brian Ln
- 1060 W Belleview Ave
- 1136 San Carlos St
- 1146 San Carlos St
- 1156 San Carlos St
- 1116 San Carlos St
- 1135 N San Carlos
- 1135 San Carlos St
- 0 San Carlos St
- 1106 San Carlos St
- 1106 N San Carlos
- 1125 San Carlos St
- 1115 San Carlos St
- 1166 San Carlos St
- 1145 San Carlos St
- 1105 N San Carlos
- 1155 San Carlos St
- 1096 San Carlos St
- 1176 San Carlos St
- 1175 San Carlos St
- 1165 San Carlos St
- 1095 San Carlos St