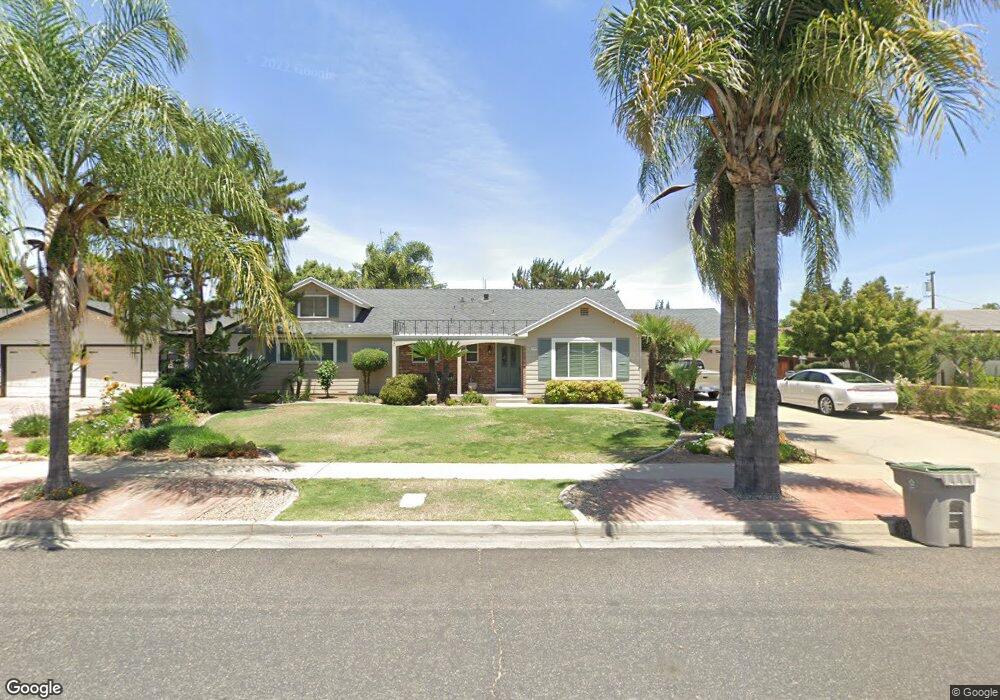
1136 W Stuart Ave Fresno, CA 93711
Bullard NeighborhoodEstimated Value: $440,000 - $552,000
3
Beds
2
Baths
1,965
Sq Ft
$253/Sq Ft
Est. Value
About This Home
This home is located at 1136 W Stuart Ave, Fresno, CA 93711 and is currently estimated at $497,388, approximately $253 per square foot. 1136 W Stuart Ave is a home located in Fresno County with nearby schools including Gibson Elementary School, Tenaya Middle School, and Bullard High School.
Ownership History
Date
Name
Owned For
Owner Type
Purchase Details
Closed on
Apr 25, 2024
Sold by
Lindegren Paul Henry and Lindegren Pamela Ann
Bought by
Lindegren Family Trust and Lindegren
Current Estimated Value
Purchase Details
Closed on
Apr 11, 2024
Sold by
Lindegren Paul Henry and Lindegren Pamela Ann
Bought by
Lindegren Family Trust and Lindegren
Purchase Details
Closed on
Sep 7, 2010
Sold by
Department Of Veterans Affairs Of The St
Bought by
Lindegren Paul H and Lindegren Pamela A
Home Financials for this Owner
Home Financials are based on the most recent Mortgage that was taken out on this home.
Original Mortgage
$151,000
Interest Rate
3.85%
Mortgage Type
New Conventional
Purchase Details
Closed on
Jun 2, 1997
Sold by
Stein Fred G and Ann Dee
Bought by
Va
Create a Home Valuation Report for This Property
The Home Valuation Report is an in-depth analysis detailing your home's value as well as a comparison with similar homes in the area
Home Values in the Area
Average Home Value in this Area
Purchase History
| Date | Buyer | Sale Price | Title Company |
|---|---|---|---|
| Lindegren Family Trust | -- | None Listed On Document | |
| Lindegren Family Trust | -- | None Listed On Document | |
| Lindegren Paul H | -- | Lsi | |
| Va | $131,000 | Commonwealth Land Title Ins |
Source: Public Records
Mortgage History
| Date | Status | Borrower | Loan Amount |
|---|---|---|---|
| Previous Owner | Lindegren Paul H | $151,000 |
Source: Public Records
Tax History Compared to Growth
Tax History
| Year | Tax Paid | Tax Assessment Tax Assessment Total Assessment is a certain percentage of the fair market value that is determined by local assessors to be the total taxable value of land and additions on the property. | Land | Improvement |
|---|---|---|---|---|
| 2025 | $2,343 | $198,607 | $79,824 | $118,783 |
| 2024 | $2,343 | $194,713 | $78,259 | $116,454 |
| 2023 | $2,343 | $190,896 | $76,725 | $114,171 |
| 2022 | $2,264 | $187,154 | $75,221 | $111,933 |
| 2021 | $2,200 | $183,486 | $73,747 | $109,739 |
| 2020 | $2,190 | $181,605 | $72,991 | $108,614 |
| 2019 | $2,103 | $178,045 | $71,560 | $106,485 |
| 2018 | $2,056 | $174,555 | $70,157 | $104,398 |
| 2017 | $2,019 | $171,133 | $68,782 | $102,351 |
| 2016 | $1,951 | $167,779 | $67,434 | $100,345 |
| 2015 | $1,920 | $165,260 | $66,422 | $98,838 |
| 2014 | $1,880 | $162,023 | $65,121 | $96,902 |
Source: Public Records
Map
Nearby Homes
- 1232 W Mesa Ave
- 1387 W Sample Ave
- 1229 W Bullard Ave Unit 149
- 1229 W Bullard Ave Unit 105
- 1041 W Sierra Ave
- 671 W Sample Ave
- 6260 N Palm Ave Unit 111
- 6447 N Vagedes Ave
- 5610 N Arthur Ave
- 6300 N Palm Ave Unit 125
- 6300 N Palm Ave Unit 105
- 696 W Celeste Ave
- 5672 N Ferger Ave
- 1545 W Calimyrna Ave
- 6265 N Colonial Ave
- 1590 W Escalon Ave
- 6594 N Farris Ave
- 1486 W Roberts Ave
- 1611 W Escalon Ave
- 715 W Browning Ave
- 1118 W Stuart Ave
- 1154 W Stuart Ave
- 1137 W Escalon Ave
- 1155 W Escalon Ave
- 1119 W Escalon Ave
- 1172 W Stuart Ave
- 1135 W Stuart Ave
- 1117 W Stuart Ave
- 1153 W Stuart Ave
- 1173 W Escalon Ave
- 1094 W Stuart Ave
- 1171 W Stuart Ave
- 1190 W Stuart Ave
- 1095 W Escalon Ave
- 1191 W Escalon Ave
- 1093 W Stuart Ave
- 1134 W Mesa Ave
- 1082 W Stuart Ave
- 1140 W Escalon Ave
- 1189 W Stuart Ave