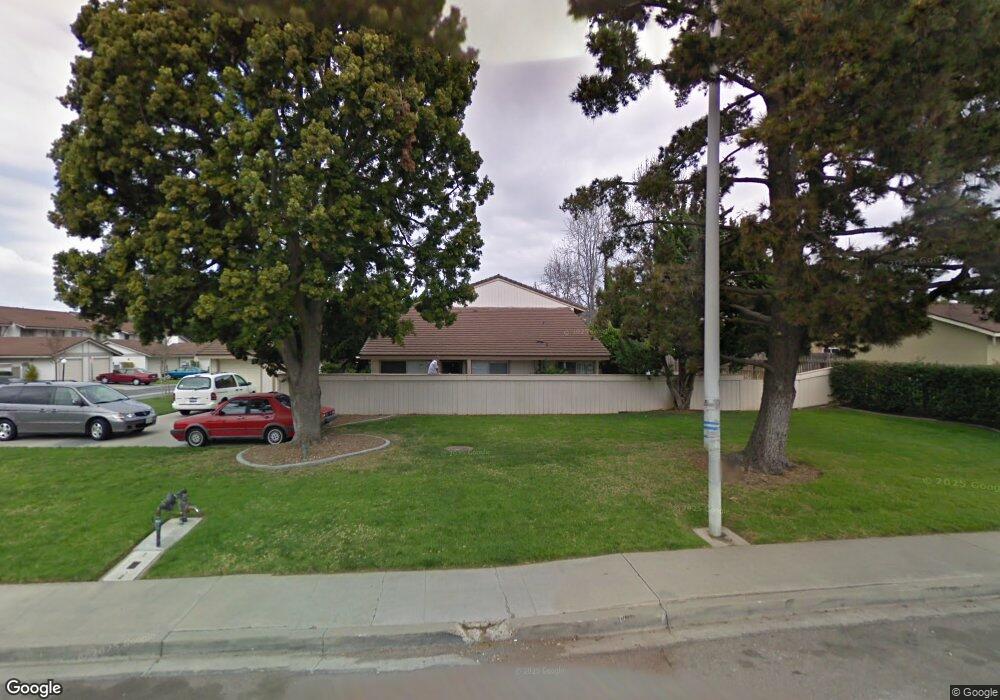
11360 Poblado Rd Unit 79 San Diego, CA 92127
Rancho Bernardo NeighborhoodEstimated Value: $507,973 - $600,000
2
Beds
1
Bath
840
Sq Ft
$663/Sq Ft
Est. Value
About This Home
This home is located at 11360 Poblado Rd Unit 79, San Diego, CA 92127 and is currently estimated at $556,993, approximately $663 per square foot. 11360 Poblado Rd Unit 79 is a home located in San Diego County with nearby schools including Westwood Elementary School, Bernardo Heights Middle, and Rancho Bernardo High.
Ownership History
Date
Name
Owned For
Owner Type
Purchase Details
Closed on
Sep 10, 2010
Sold by
Fenter Jessie Lee
Bought by
Fenter Jessie Lee and Fenter Anne Marie
Current Estimated Value
Home Financials for this Owner
Home Financials are based on the most recent Mortgage that was taken out on this home.
Original Mortgage
$230,187
Outstanding Balance
$150,760
Interest Rate
4.28%
Mortgage Type
New Conventional
Estimated Equity
$406,233
Purchase Details
Closed on
Aug 11, 1998
Sold by
Fenter Jesse L and Lee Jessie Lee
Bought by
Fenter Jessie Lee
Home Financials for this Owner
Home Financials are based on the most recent Mortgage that was taken out on this home.
Original Mortgage
$93,374
Interest Rate
6.91%
Mortgage Type
FHA
Purchase Details
Closed on
Oct 5, 1993
Sold by
Sixt John David
Bought by
Fenter Jesse Lee
Home Financials for this Owner
Home Financials are based on the most recent Mortgage that was taken out on this home.
Original Mortgage
$99,450
Interest Rate
6.95%
Mortgage Type
FHA
Create a Home Valuation Report for This Property
The Home Valuation Report is an in-depth analysis detailing your home's value as well as a comparison with similar homes in the area
Home Values in the Area
Average Home Value in this Area
Purchase History
| Date | Buyer | Sale Price | Title Company |
|---|---|---|---|
| Fenter Jessie Lee | -- | First American Title In Sco | |
| Fenter Jessie Lee | -- | Fidelity National Title | |
| Fenter Jesse Lee | $102,500 | Guardian Title Company | |
| Sixt John David | -- | Guardian Title Company |
Source: Public Records
Mortgage History
| Date | Status | Borrower | Loan Amount |
|---|---|---|---|
| Open | Fenter Jessie Lee | $230,187 | |
| Closed | Fenter Jessie Lee | $93,374 | |
| Closed | Fenter Jesse Lee | $99,450 |
Source: Public Records
Tax History Compared to Growth
Tax History
| Year | Tax Paid | Tax Assessment Tax Assessment Total Assessment is a certain percentage of the fair market value that is determined by local assessors to be the total taxable value of land and additions on the property. | Land | Improvement |
|---|---|---|---|---|
| 2025 | $1,969 | $174,179 | $96,770 | $77,409 |
| 2024 | $1,969 | $170,765 | $94,873 | $75,892 |
| 2023 | $1,928 | $167,417 | $93,013 | $74,404 |
| 2022 | $1,896 | $164,136 | $91,190 | $72,946 |
| 2021 | $1,872 | $160,918 | $89,402 | $71,516 |
| 2020 | $1,847 | $159,269 | $88,486 | $70,783 |
| 2019 | $1,800 | $156,147 | $86,751 | $69,396 |
| 2018 | $1,750 | $153,086 | $85,050 | $68,036 |
| 2017 | $1,704 | $150,085 | $83,383 | $66,702 |
| 2016 | $1,669 | $147,144 | $81,749 | $65,395 |
| 2015 | $1,644 | $144,935 | $80,522 | $64,413 |
| 2014 | $1,607 | $142,097 | $78,945 | $63,152 |
Source: Public Records
Map
Nearby Homes
- 17408 Caminito Baya
- 17185 W Bernardo Dr Unit 203
- 17195 W Bernardo Dr Unit 206
- 17141 W Bernardo Dr Unit 204
- 17093 W Bernardo Dr Unit 202
- 17093 W Bernardo Dr Unit 205
- 11409 Duenda Rd
- 17544 Ashburton Rd
- 11515 Escoba Place
- 11864 Bernardo Terrace Unit C
- 11872 Bernardo Terrace Unit E
- 11825 Caminito Ronaldo Unit 119
- 11915 Fairhope Rd
- 18103 Smokesignal Dr
- 17885 Caminito Pinero Unit 255
- 17924 Cabela Dr
- 17892 Creciente Way
- 17161 Alva Rd Unit 1214
- 17161 Alva Rd Unit 1523
- 17161 Alva Rd Unit 221
- 11436 Florindo Rd
- 11428 Florindo Rd
- 11426 Florindo Rd
- 11104 Poblado Rd Unit 1
- 11108 Poblado Rd
- 11408 Florindo Rd
- 11336 Poblado Rd
- 11296 Poblado Rd
- 11284 Poblado Rd
- 11380 Poblado Rd
- 11372 Poblado Rd Unit 82
- 11368 Poblado Rd
- 11178 Poblado Rd
- 11148 Poblado Rd
- 11388 Poblado Rd
- 11260 Poblado Rd
- 11244 Poblado Rd Unit 30
- 11236 Poblado Rd Unit 28
- 11224 Poblado Rd
- 11214 Poblado Rd