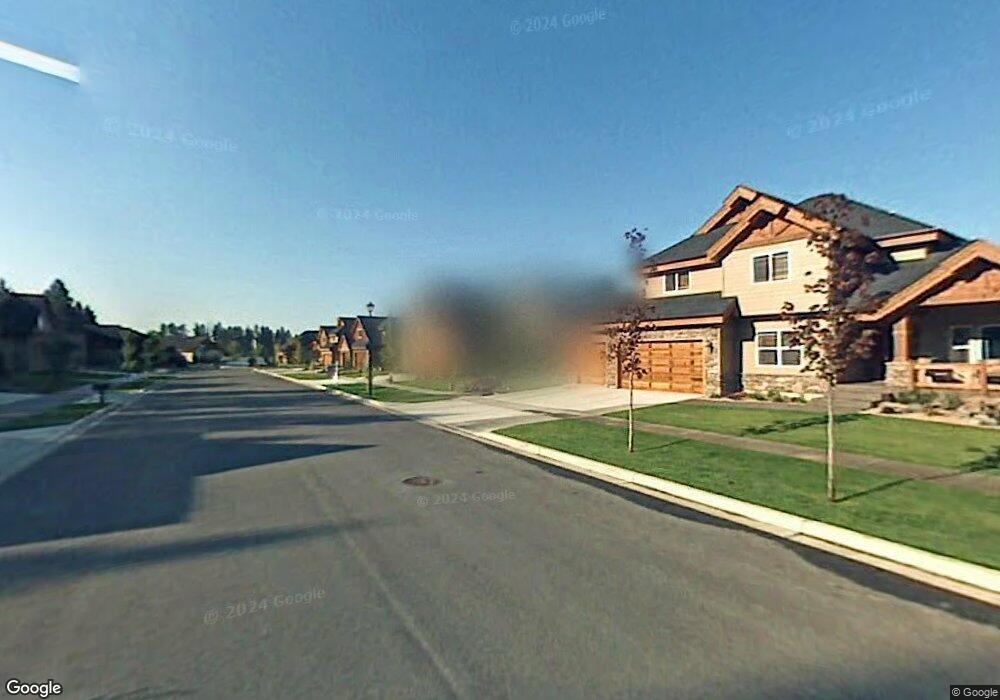
11361 N Cattle Dr Hayden, ID 83835
Estimated Value: $978,000 - $995,983
3
Beds
3
Baths
3,172
Sq Ft
$311/Sq Ft
Est. Value
About This Home
This home is located at 11361 N Cattle Dr, Hayden, ID 83835 and is currently estimated at $986,746, approximately $311 per square foot. 11361 N Cattle Dr is a home with nearby schools including Hayden Meadows Elementary School, Canfield Middle School, and Coeur d'Alene High School.
Ownership History
Date
Name
Owned For
Owner Type
Purchase Details
Closed on
Feb 16, 2012
Sold by
Clements Jon M and Hall Nancy C
Bought by
Clements Jon M and Hall Nancy C
Current Estimated Value
Purchase Details
Closed on
Jan 28, 2009
Sold by
Clements Jon M and Hall Nancy C
Bought by
Clements Jon M and Hall Nancy C
Purchase Details
Closed on
Jul 31, 2007
Sold by
Clements Jon M and Hall Nancy C
Bought by
Clements Jon M and Hall Nancy C
Purchase Details
Closed on
Aug 11, 2006
Sold by
Rosenberger Construction Llc
Bought by
Clements Jon M and Hall Nancy C
Home Financials for this Owner
Home Financials are based on the most recent Mortgage that was taken out on this home.
Original Mortgage
$125,000
Interest Rate
6.37%
Mortgage Type
Adjustable Rate Mortgage/ARM
Create a Home Valuation Report for This Property
The Home Valuation Report is an in-depth analysis detailing your home's value as well as a comparison with similar homes in the area
Home Values in the Area
Average Home Value in this Area
Purchase History
| Date | Buyer | Sale Price | Title Company |
|---|---|---|---|
| Clements Jon M | -- | None Available | |
| Clements Jon M | -- | -- | |
| Clements Jon M | -- | -- | |
| Clements Jon M | -- | -- | |
| Clements Jon M | -- | -- |
Source: Public Records
Mortgage History
| Date | Status | Borrower | Loan Amount |
|---|---|---|---|
| Previous Owner | Clements Jon M | $125,000 |
Source: Public Records
Tax History Compared to Growth
Tax History
| Year | Tax Paid | Tax Assessment Tax Assessment Total Assessment is a certain percentage of the fair market value that is determined by local assessors to be the total taxable value of land and additions on the property. | Land | Improvement |
|---|---|---|---|---|
| 2025 | $1,768 | $916,960 | $250,000 | $666,960 |
| 2024 | $1,486 | $858,450 | $225,000 | $633,450 |
| 2023 | $1,486 | $820,000 | $210,000 | $610,000 |
| 2022 | $1,919 | $929,300 | $240,000 | $689,300 |
| 2021 | $1,946 | $623,414 | $150,000 | $473,414 |
| 2020 | $2,091 | $534,314 | $115,500 | $418,814 |
| 2019 | $2,677 | $478,760 | $105,000 | $373,760 |
| 2018 | $3,500 | $462,224 | $102,000 | $360,224 |
| 2017 | $3,461 | $434,210 | $93,600 | $340,610 |
| 2016 | $3,335 | $403,870 | $93,600 | $310,270 |
| 2015 | $1,584 | $376,182 | $78,000 | $298,182 |
| 2013 | $2,794 | $316,290 | $57,500 | $258,790 |
Source: Public Records
Map
Nearby Homes
- 11042 N Cattle Dr
- 1538 E Bruin Loop
- 1080 E Sleeping Deer Ave
- 1560 E Bruin Loop
- 1002 E Sleeping Deer Ave
- 952 E Steeple Chase Rd
- 1243 E Sleeping Deer Ave
- 957 E Steeple Chase Rd
- 981 E Steeple Chase Rd
- 963 E Steeple Chase Rd
- 10934 N Maple St
- 969 E Steeple Chase Rd
- 987 E Steeple Chase Rd
- 975 E Steeple Chase Rd
- 995 E Steeple Chase Rd
- 1003 E Steeple Chase Rd
- 1467 E Lacey Ave
- 11388 N Armonia Way
- 10589 N Crimson Dr
- 122 E Walrose Loop
- 11371 N Cattle Dr
- 11341 N Cattle Dr
- 11366 N Riata Rd
- 11340 N Riata Rd
- 11392 N Riata Rd
- 11356 N Cattle Dr
- 11379 N Cattle Dr
- 11325 N Cattle Dr
- 11372 N Cattle Dr
- 11336 N Cattle Dr
- 11418 N Riata Rd
- 11316 N Riata Rd
- 11318 N Cattle Dr
- 11393 N Cattle Dr
- 11365 N Riata Rd
- 11388 N Cattle Dr
- 11339 N Riata Rd
- 11391 N Riata Rd
- 11446 N Riata Rd
- 11417 N Riata Rd