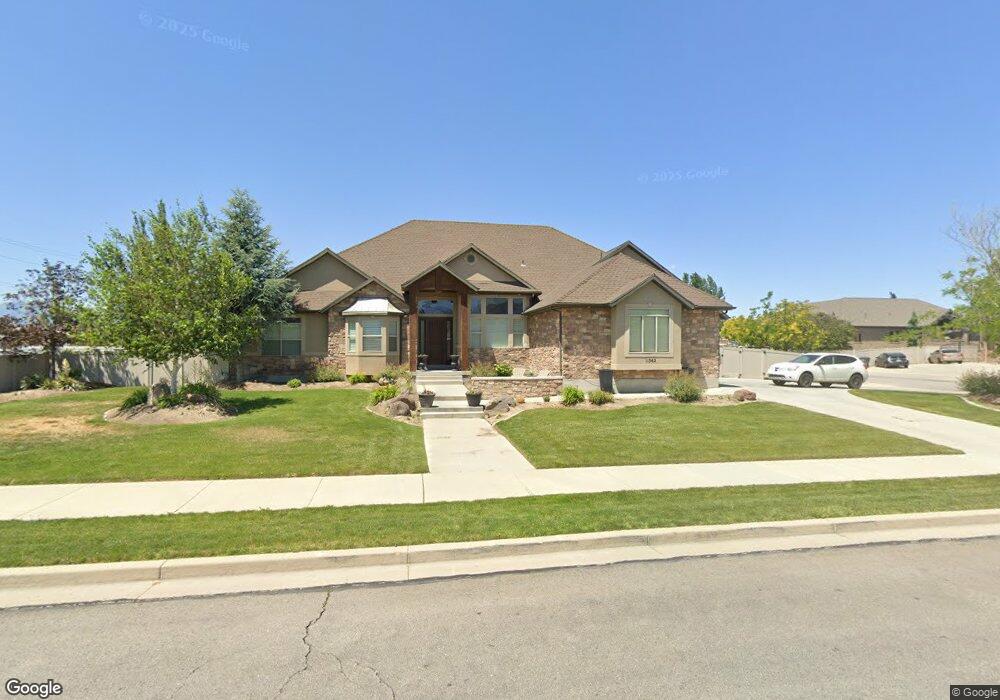
11362 S 2420 W South Jordan, UT 84095
Estimated Value: $909,000 - $971,074
3
Beds
4
Baths
4,840
Sq Ft
$196/Sq Ft
Est. Value
About This Home
This home is located at 11362 S 2420 W, South Jordan, UT 84095 and is currently estimated at $946,769, approximately $195 per square foot. 11362 S 2420 W is a home located in Salt Lake County with nearby schools including Monte Vista Elementary School, South Jordan Middle School, and Hawthorn Academy South Jordan.
Ownership History
Date
Name
Owned For
Owner Type
Purchase Details
Closed on
Apr 23, 2010
Sold by
Us Bank National Association
Bought by
Tanner Shae L
Current Estimated Value
Home Financials for this Owner
Home Financials are based on the most recent Mortgage that was taken out on this home.
Original Mortgage
$17,500
Outstanding Balance
$13,184
Interest Rate
4.92%
Mortgage Type
Credit Line Revolving
Estimated Equity
$933,585
Purchase Details
Closed on
Aug 17, 2009
Sold by
Pringle Evan K and Phillips Tyler C
Bought by
Us Bank National Association
Purchase Details
Closed on
May 14, 2009
Sold by
Prngle Evan
Bought by
Nielson Andrew
Purchase Details
Closed on
Jun 28, 2007
Sold by
Phillips Tyler
Bought by
Pringle Evan
Home Financials for this Owner
Home Financials are based on the most recent Mortgage that was taken out on this home.
Original Mortgage
$53,998
Interest Rate
6.21%
Mortgage Type
Purchase Money Mortgage
Purchase Details
Closed on
Apr 10, 2007
Sold by
Genesis Estates Llc
Bought by
Pringle Evan and Phillips Tyler C
Home Financials for this Owner
Home Financials are based on the most recent Mortgage that was taken out on this home.
Original Mortgage
$607,500
Interest Rate
6.29%
Mortgage Type
Purchase Money Mortgage
Purchase Details
Closed on
Apr 2, 2007
Sold by
Pringle Evan and Phillips Tyler C
Bought by
Genesis Estates Llc
Home Financials for this Owner
Home Financials are based on the most recent Mortgage that was taken out on this home.
Original Mortgage
$607,500
Interest Rate
6.29%
Mortgage Type
Purchase Money Mortgage
Purchase Details
Closed on
Mar 30, 2007
Sold by
Sudbury Scott D
Bought by
Genesis Estates Llc and Sebus Inc
Home Financials for this Owner
Home Financials are based on the most recent Mortgage that was taken out on this home.
Original Mortgage
$607,500
Interest Rate
6.29%
Mortgage Type
Purchase Money Mortgage
Purchase Details
Closed on
Nov 9, 2005
Sold by
Shumway Paul H
Bought by
Sudbury Scott D
Home Financials for this Owner
Home Financials are based on the most recent Mortgage that was taken out on this home.
Original Mortgage
$600,000
Interest Rate
5.93%
Mortgage Type
Purchase Money Mortgage
Purchase Details
Closed on
Nov 2, 2005
Sold by
Quinella Park Llc
Bought by
Shumway Paul H
Home Financials for this Owner
Home Financials are based on the most recent Mortgage that was taken out on this home.
Original Mortgage
$600,000
Interest Rate
5.93%
Mortgage Type
Purchase Money Mortgage
Create a Home Valuation Report for This Property
The Home Valuation Report is an in-depth analysis detailing your home's value as well as a comparison with similar homes in the area
Home Values in the Area
Average Home Value in this Area
Purchase History
| Date | Buyer | Sale Price | Title Company |
|---|---|---|---|
| Tanner Shae L | -- | First Southwestern Title | |
| Us Bank National Association | $320,542 | None Available | |
| Nielson Andrew | -- | None Available | |
| Pringle Evan | -- | Bartlett Title Ins Agcy | |
| Pringle Evan | -- | Hickman Land Title Co | |
| Genesis Estates Llc | -- | Hickman Land Title Co | |
| Genesis Estates Llc | -- | Hickman Land Title Co | |
| Sudbury Scott D | -- | Merrill Title | |
| Shumway Paul H | -- | Merrill Title |
Source: Public Records
Mortgage History
| Date | Status | Borrower | Loan Amount |
|---|---|---|---|
| Open | Tanner Shae L | $17,500 | |
| Open | Tanner Shae L | $281,520 | |
| Previous Owner | Pringle Evan | $53,998 | |
| Previous Owner | Genesis Estates Llc | $607,500 | |
| Previous Owner | Sudbury Scott D | $600,000 | |
| Previous Owner | Shumway Paul H | $150,000 |
Source: Public Records
Tax History Compared to Growth
Tax History
| Year | Tax Paid | Tax Assessment Tax Assessment Total Assessment is a certain percentage of the fair market value that is determined by local assessors to be the total taxable value of land and additions on the property. | Land | Improvement |
|---|---|---|---|---|
| 2025 | $4,474 | $872,600 | $262,000 | $610,600 |
| 2024 | $4,474 | $849,400 | $254,300 | $595,100 |
| 2023 | $4,550 | $815,100 | $233,300 | $581,800 |
| 2022 | $4,763 | $836,300 | $198,200 | $638,100 |
| 2021 | $3,791 | $610,800 | $152,500 | $458,300 |
| 2020 | $3,636 | $549,100 | $152,500 | $396,600 |
| 2019 | $3,596 | $533,700 | $118,900 | $414,800 |
| 2018 | $3,328 | $491,500 | $118,900 | $372,600 |
| 2017 | $3,238 | $468,700 | $118,900 | $349,800 |
| 2016 | $3,198 | $438,700 | $118,900 | $319,800 |
| 2015 | $2,969 | $396,000 | $127,500 | $268,500 |
| 2014 | $2,833 | $371,300 | $121,000 | $250,300 |
Source: Public Records
Map
Nearby Homes
- 2410 W 11400 S
- 11513 S Jackson Downs Way
- 2602 W 11625 S
- 2626 W Midas Side Way
- 2732 W Lizzi Cove
- 11707 S Myers Park Ln Unit 111
- 2817 W 11460 St S Unit 203
- 2511 W 11730 S
- 11716 S 2610 W
- 11666 S Gold Dust Dr
- 11788 S Myers Park Ln Unit 101
- 11423 S Polo Club Ct
- 2295 W Myers Ln
- 2834 Proudest Ln Unit 247
- 3028 W Wilkins Peak Ct
- 10868 Reta View Ct Unit 232
- Beatrix Plan at McKee Farms
- 1767 W Lunford Ln
- 10749 S 2200 W
- 11087 S Becks Bend Ln
- 11376 S 2420 W
- 11376 S 2420 W Unit 1
- 2436 W 11400 S
- 11341 S 2420 W
- 2432 W 11340 S
- 2438 W 11340 S Unit 3
- 11328 S 2420 W Unit 4
- 2418 W 11400 S
- 11329 S 2450 W
- 11327 S 2420 W
- 2448 W 11400 S
- 2474 W 11400 S
- 11334 S 2450 W Unit 14
- 11334 S 2450 W
- 2398 W 11400 S
- 11348 Applegrove Ln
- 11316 S 2420 W
- 11317 S 2450 W
- 11416 S Chapel Rim Way
- 11416 Chapel Rim Way