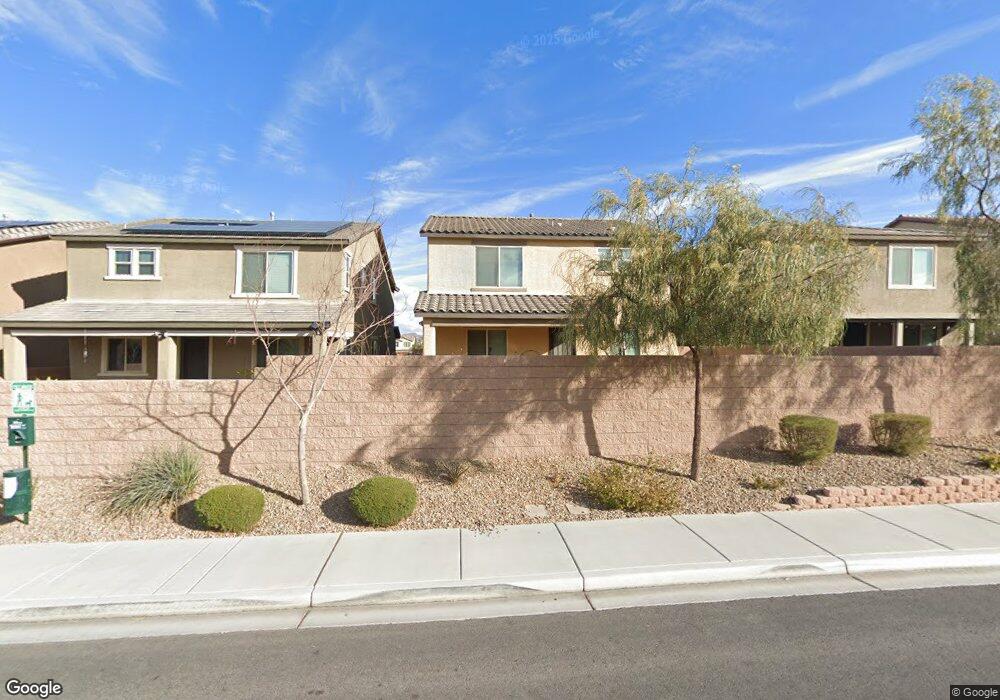
11365 Beta Ceti St Las Vegas, NV 89183
Silverado Ranch NeighborhoodEstimated Value: $509,000 - $521,000
3
Beds
3
Baths
2,323
Sq Ft
$222/Sq Ft
Est. Value
About This Home
This home is located at 11365 Beta Ceti St, Las Vegas, NV 89183 and is currently estimated at $515,697, approximately $221 per square foot. 11365 Beta Ceti St is a home with nearby schools including Steve Schorr Elementary School, Del E. Webb Middle School, and Liberty High School.
Ownership History
Date
Name
Owned For
Owner Type
Purchase Details
Closed on
Oct 17, 2020
Sold by
Harcourt Eidon B and Harcourt Michelle O
Bought by
Harcourt Eldon B and Harcourt Michelle O
Current Estimated Value
Home Financials for this Owner
Home Financials are based on the most recent Mortgage that was taken out on this home.
Original Mortgage
$251,000
Outstanding Balance
$222,844
Interest Rate
2.8%
Mortgage Type
New Conventional
Estimated Equity
$292,853
Purchase Details
Closed on
Mar 26, 2018
Sold by
Harcourt Eldon B and Harcourt Eldon
Bought by
Harcourt Eldon B and Leung Michelle O
Home Financials for this Owner
Home Financials are based on the most recent Mortgage that was taken out on this home.
Original Mortgage
$260,000
Interest Rate
4.38%
Mortgage Type
New Conventional
Purchase Details
Closed on
Nov 16, 2017
Sold by
Richmond American Homes Of Nevada Inc
Bought by
Harcourt Eldon
Home Financials for this Owner
Home Financials are based on the most recent Mortgage that was taken out on this home.
Original Mortgage
$292,531
Interest Rate
3.85%
Mortgage Type
FHA
Create a Home Valuation Report for This Property
The Home Valuation Report is an in-depth analysis detailing your home's value as well as a comparison with similar homes in the area
Home Values in the Area
Average Home Value in this Area
Purchase History
| Date | Buyer | Sale Price | Title Company |
|---|---|---|---|
| Harcourt Eldon B | -- | Lawyers Title Of Nevada | |
| Harcourt Eldon B | $260,000 | Lawyers Title Of Nevada C | |
| Harcourt Eldon | $304,956 | Ticor Title Las Vegas |
Source: Public Records
Mortgage History
| Date | Status | Borrower | Loan Amount |
|---|---|---|---|
| Open | Harcourt Eldon B | $251,000 | |
| Closed | Harcourt Eldon B | $260,000 | |
| Previous Owner | Harcourt Eldon | $292,531 |
Source: Public Records
Tax History Compared to Growth
Tax History
| Year | Tax Paid | Tax Assessment Tax Assessment Total Assessment is a certain percentage of the fair market value that is determined by local assessors to be the total taxable value of land and additions on the property. | Land | Improvement |
|---|---|---|---|---|
| 2025 | $3,311 | $164,312 | $44,100 | $120,212 |
| 2024 | $3,216 | $164,312 | $44,100 | $120,212 |
| 2023 | $361 | $154,134 | $42,000 | $112,134 |
| 2022 | $3,423 | $140,805 | $38,850 | $101,955 |
| 2021 | $3,169 | $127,740 | $31,500 | $96,240 |
| 2020 | $2,940 | $120,213 | $32,900 | $87,313 |
| 2019 | $2,904 | $110,857 | $28,000 | $82,857 |
| 2018 | $2,771 | $104,140 | $22,750 | $81,390 |
| 2017 | $667 | $22,750 | $22,750 | $0 |
| 2016 | $361 | $0 | $0 | $0 |
Source: Public Records
Map
Nearby Homes
- 81 Einstein Ridge Way
- 124 Nola Stream Ct
- 11435 Castor St
- 11376 Castor St
- 60 Newton Ridge Way
- 127 Birch Ridge Ave
- 178 Elexese Ct
- 22 Kaku Ridge Way
- 11560 S Stivali St
- 68 Jewel Mine Ave
- 20 Barbara Ln Unit 58
- 20 Barbara Ln Unit 47
- 232 Star Ruby Ct
- 120 Chartan Ave
- 0 La Cienega and E Starr
- 164 Glenbrook Estates Dr
- 10230 S Las Vegas Blvd
- 72 Dark Creek Ave
- 55 Siddall Ave
- 78 Siddall Ave
- 11359 Beta Ceti St
- 11371 Beta Ceti St
- 11377 Beta Ceti St
- 11353 Beta Ceti St
- 98 Einstein Ridge Way Unit Lot 78
- 11347 Beta Ceti St
- 11383 Beta Ceti St
- 11366 Beta Ceti St
- 11372 Beta Ceti St
- 11341 Beta Ceti St
- 11378 Beta Ceti St
- 11389 Beta Ceti St
- 11342 Quantum Brooks St
- 11334 Quantum Brooks St Unit Lot 8
- 11334 Quantum Brooks St
- 112 Volans Ave
- 11350 Quantum Brooks St Unit Lot 10
- 11326 Quantum Brooks St Unit Lot 7
- 11335 Beta Ceti St
- 116 Volans Ave