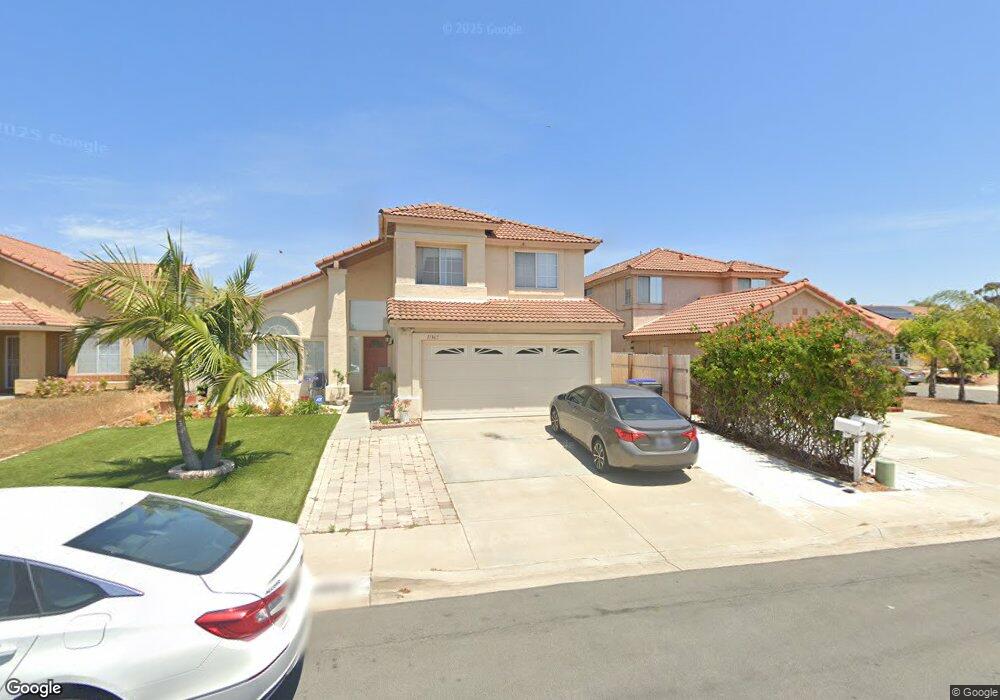
11365 Herring Cove San Diego, CA 92126
Mira Mesa NeighborhoodEstimated Value: $1,139,973 - $1,320,000
4
Beds
3
Baths
1,816
Sq Ft
$680/Sq Ft
Est. Value
About This Home
This home is located at 11365 Herring Cove, San Diego, CA 92126 and is currently estimated at $1,234,993, approximately $680 per square foot. 11365 Herring Cove is a home located in San Diego County with nearby schools including Sandburg Elementary School, Challenger Middle School, and Mira Mesa High School.
Ownership History
Date
Name
Owned For
Owner Type
Purchase Details
Closed on
Feb 1, 2021
Sold by
Vanpham Thinh and Pham Rose Hoang
Bought by
Vanpham Thinh and Pham Rose Hoang
Current Estimated Value
Home Financials for this Owner
Home Financials are based on the most recent Mortgage that was taken out on this home.
Original Mortgage
$400,000
Outstanding Balance
$326,388
Interest Rate
2.7%
Mortgage Type
New Conventional
Estimated Equity
$908,605
Purchase Details
Closed on
Aug 12, 2015
Sold by
Vanpham Thinh and Pham Rose Hoang
Bought by
The Pham Trust and Pham Rose Hoang
Home Financials for this Owner
Home Financials are based on the most recent Mortgage that was taken out on this home.
Original Mortgage
$186,000
Interest Rate
3.86%
Mortgage Type
New Conventional
Purchase Details
Closed on
Jul 6, 2004
Sold by
Pham Thinh V and Pham Rose
Bought by
Vanvanpham Thinh Van and Pham Rose Hoang
Purchase Details
Closed on
Jul 10, 1997
Sold by
Cacho Rodencio A and Viloria Benjamin T
Bought by
Pham Thinh and Pham Rose
Home Financials for this Owner
Home Financials are based on the most recent Mortgage that was taken out on this home.
Original Mortgage
$150,000
Interest Rate
7.61%
Purchase Details
Closed on
Jun 4, 1990
Create a Home Valuation Report for This Property
The Home Valuation Report is an in-depth analysis detailing your home's value as well as a comparison with similar homes in the area
Home Values in the Area
Average Home Value in this Area
Purchase History
| Date | Buyer | Sale Price | Title Company |
|---|---|---|---|
| Vanpham Thinh | -- | First American Title Ins Co | |
| Vanpham Thinh | -- | First American Title Ins Co | |
| The Pham Trust | -- | First American Title Company | |
| Vanpham Thinh | -- | First American Title Company | |
| Vanvanpham Thinh Van | -- | -- | |
| Pham Thinh | $193,000 | Chicago Title Co | |
| -- | $223,000 | -- |
Source: Public Records
Mortgage History
| Date | Status | Borrower | Loan Amount |
|---|---|---|---|
| Open | Vanpham Thinh | $400,000 | |
| Closed | Vanpham Thinh | $186,000 | |
| Closed | Pham Thinh | $150,000 |
Source: Public Records
Tax History Compared to Growth
Tax History
| Year | Tax Paid | Tax Assessment Tax Assessment Total Assessment is a certain percentage of the fair market value that is determined by local assessors to be the total taxable value of land and additions on the property. | Land | Improvement |
|---|---|---|---|---|
| 2025 | $3,851 | $308,145 | $107,847 | $200,298 |
| 2024 | $3,851 | $302,104 | $105,733 | $196,371 |
| 2023 | $3,759 | $296,181 | $103,660 | $192,521 |
| 2022 | $3,650 | $290,375 | $101,628 | $188,747 |
| 2021 | $3,615 | $284,683 | $99,636 | $185,047 |
| 2020 | $3,570 | $281,765 | $98,615 | $183,150 |
| 2019 | $3,505 | $276,241 | $96,682 | $179,559 |
| 2018 | $3,281 | $270,826 | $94,787 | $176,039 |
| 2017 | $80 | $265,517 | $92,929 | $172,588 |
| 2016 | $3,141 | $260,311 | $91,107 | $169,204 |
| 2015 | $3,096 | $256,402 | $89,739 | $166,663 |
| 2014 | $3,049 | $251,381 | $87,982 | $163,399 |
Source: Public Records
Map
Nearby Homes
- 8054 Los Sabalos St
- 8141 Calle Nueva
- 11329 Avenida Del Gato
- 11305 Avenida Del Gato
- 11323 Trebol St
- 7758 Prairie Shadow Rd
- 11149 Blythe Rd
- 7646 Acama St
- 7636 Acama St
- 11153 Acaso Way
- 11313 Zapata Ave Unit 6
- 8419 Menkar Rd
- 11161 Camino Ruiz Unit 44
- 8393 Capricorn Way Unit 90
- 11187 Kelowna Rd Unit 76
- 8324 Calle Calzada
- 8468 Calle Morelos
- 8333 Calle Calzada
- 11262 Ganesta Rd
- 11545 Caminito la Bar Unit 74
- 11375 Herring Cove
- 11355 Herring Cove
- 11385 Herring Cove
- 11364 Lott Point
- 11374 Lott Point
- 11354 Lott Point
- 8040 Santa Arminta Ave
- 11384 Lott Point
- 11395 Herring Cove
- 8035 Santa Arminta Ave
- 8045 Santa Arminta Ave
- 8025 Santa Arminta Ave
- 11370 Herring Cove
- 11394 Lott Point
- 8032 Santa Arminta Ave
- 8055 Santa Arminta Ave
- 8015 Santa Arminta Ave
- 11380 Herring Cove
- 8065 Santa Arminta Ave
- 11450 Corley Ct