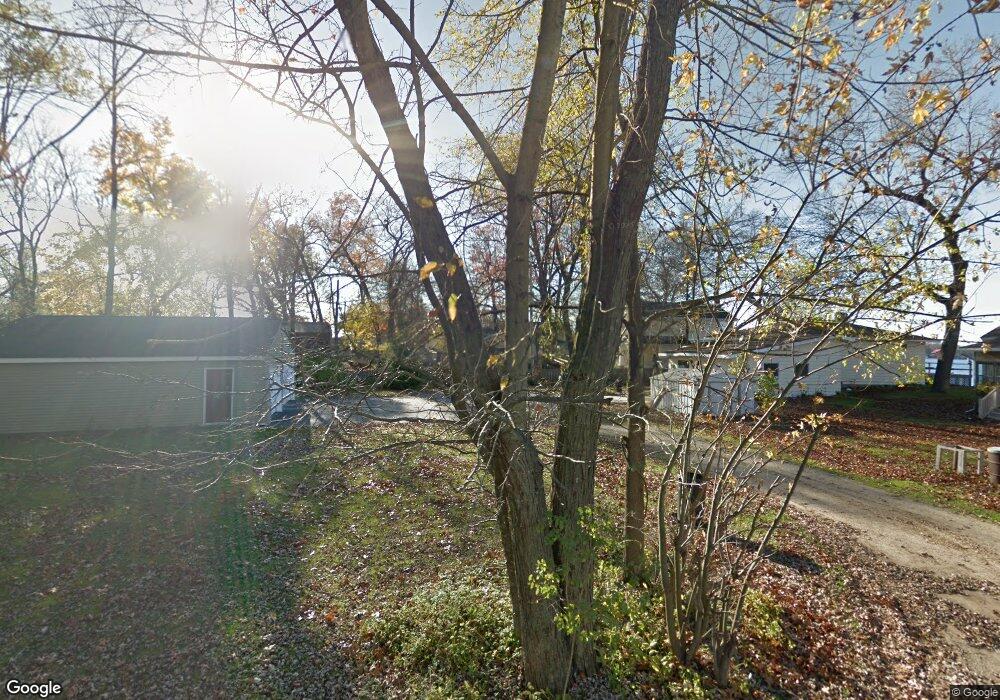
11366 E Shore Dr Delton, MI 49046
Estimated Value: $179,984 - $272,000
Studio
--
Bath
--
Sq Ft
13,504
Sq Ft Lot
About This Home
This home is located at 11366 E Shore Dr, Delton, MI 49046 and is currently estimated at $209,996. 11366 E Shore Dr is a home located in Barry County with nearby schools including Delton Kellogg Elementary School, Delton-Kellogg Middle School, and Delton-Kellogg High School.
Ownership History
Date
Name
Owned For
Owner Type
Purchase Details
Closed on
May 6, 2021
Sold by
Ackerson Living Trust
Bought by
Keagle Gregory R and Keagle Tammy L
Current Estimated Value
Home Financials for this Owner
Home Financials are based on the most recent Mortgage that was taken out on this home.
Original Mortgage
$70,000
Outstanding Balance
$26,476
Interest Rate
3.1%
Mortgage Type
Balloon
Estimated Equity
$183,520
Purchase Details
Closed on
Oct 6, 2017
Sold by
Elgersma Harvey and Elgersma Janet A
Bought by
Ackerson Craig W and Ackerson Kelly D
Purchase Details
Closed on
Aug 3, 2009
Sold by
Elgersma Harvey and Elgersma Janet
Bought by
Elgersma Harvey and Elgersma Janet A
Purchase Details
Closed on
May 12, 2006
Sold by
Miller Craig N and Miller Karen
Bought by
Elgersma Harvey and Elgersma Janet
Purchase Details
Closed on
Jun 30, 2004
Sold by
Blaisdell Nancy
Bought by
Miller Craig N
Create a Home Valuation Report for This Property
The Home Valuation Report is an in-depth analysis detailing your home's value as well as a comparison with similar homes in the area
Purchase History
| Date | Buyer | Sale Price | Title Company |
|---|---|---|---|
| Keagle Gregory R | $130,000 | None Listed On Document | |
| Ackerson Craig W | $120,000 | Bell Title Agency | |
| Elgersma Harvey | -- | None Available | |
| Elgersma Harvey | $128,000 | Chicago Title | |
| Miller Craig N | $75,000 | Chicago Title | |
| Miller Craig N | -- | -- |
Source: Public Records
Mortgage History
| Date | Status | Borrower | Loan Amount |
|---|---|---|---|
| Open | Keagle Gregory R | $70,000 |
Source: Public Records
Tax History
| Year | Tax Paid | Tax Assessment Tax Assessment Total Assessment is a certain percentage of the fair market value that is determined by local assessors to be the total taxable value of land and additions on the property. | Land | Improvement |
|---|---|---|---|---|
| 2025 | $2,233 | $59,100 | $0 | $0 |
| 2024 | -- | $55,300 | $0 | $0 |
| 2023 | $2,233 | $40,900 | $0 | $0 |
| 2022 | $2,233 | $40,900 | $0 | $0 |
| 2021 | $2,233 | $40,600 | $0 | $0 |
| 2020 | $0 | $39,100 | $0 | $0 |
| 2019 | $0 | $47,400 | $0 | $0 |
| 2018 | $0 | $50,300 | $0 | $0 |
| 2017 | $0 | $46,300 | $0 | $0 |
| 2016 | -- | $43,200 | $0 | $0 |
| 2015 | -- | $50,100 | $0 | $0 |
| 2014 | -- | $50,100 | $0 | $0 |
Source: Public Records
Map
Nearby Homes
- 11178 E Shore Dr
- 6961 Shoreline Dr
- 11175 E Shore Dr
- 11070 E Shore Dr
- 736 S Grove St
- 11575 Floria Rd
- 135 Mill St
- 11861 Floria Rd
- 7907 Ruble Dr
- 10798 Pleasant Lake Rd
- 11023 Pennock Ln
- 10227 S Norris Rd
- 9374 Michigan 43
- 00E N Bay Rd
- 000F N Bay Rd
- 6525 Woods Trail Dr
- 5037 2nd St
- 000B Kingsbury Rd
- 000A Kingsbury Rd
- 000D Kingsbury Rd
- 11383 E Shore Dr
- 11362 E Shore Dr
- 11386 E Shore Dr
- 11356 E Shore Dr
- 11392 E Shore Dr
- 11350 E Shore Dr
- 6726 Island Ave
- 11398 E Shore Dr
- 11356 Sprague Rd
- 11340 E Shore Dr
- 11346 E Shore Dr
- 11331 E Shore Dr
- 6741 Island Ave
- 11410 E Shore Dr
- 6741 Island Dr
- 6742 Island Ave
- 11334 E Shore Dr
- 6683 Elizabeth St
- 11422 E Shore Dr
- 6739 Island Ave
Your Personal Tour Guide
Ask me questions while you tour the home.