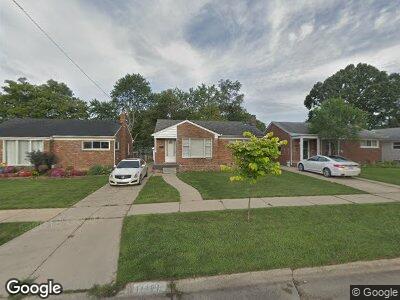
11367 Lenore Unit Bldg-Unit Redford, MI 48239
Estimated Value: $166,873 - $204,000
--
Bed
2
Baths
943
Sq Ft
$195/Sq Ft
Est. Value
About This Home
This home is located at 11367 Lenore Unit Bldg-Unit, Redford, MI 48239 and is currently estimated at $183,468, approximately $194 per square foot. 11367 Lenore Unit Bldg-Unit is a home located in Wayne County with nearby schools including John D. Pierce Middle School, Lee M. Thurston High School, and Washington-Parks Academy.
Ownership History
Date
Name
Owned For
Owner Type
Purchase Details
Closed on
Nov 4, 2020
Sold by
Carter Alvin E
Bought by
Campbell Mark
Current Estimated Value
Home Financials for this Owner
Home Financials are based on the most recent Mortgage that was taken out on this home.
Original Mortgage
$114,900
Interest Rate
2.8%
Mortgage Type
New Conventional
Purchase Details
Closed on
Jan 4, 2018
Sold by
Rempinski Christopher M
Bought by
Carter Alvin E
Home Financials for this Owner
Home Financials are based on the most recent Mortgage that was taken out on this home.
Original Mortgage
$72,750
Interest Rate
3.94%
Mortgage Type
New Conventional
Create a Home Valuation Report for This Property
The Home Valuation Report is an in-depth analysis detailing your home's value as well as a comparison with similar homes in the area
Home Values in the Area
Average Home Value in this Area
Purchase History
| Date | Buyer | Sale Price | Title Company |
|---|---|---|---|
| Campbell Mark | $114,900 | Visionary Title Agency Llc | |
| Carter Alvin E | $75,000 | Hometown One Title Agency Ll |
Source: Public Records
Mortgage History
| Date | Status | Borrower | Loan Amount |
|---|---|---|---|
| Previous Owner | Campbell Mark A | $114,900 | |
| Previous Owner | Carter Alvin E | $72,750 | |
| Previous Owner | Paff Larry J | $78,570 |
Source: Public Records
Tax History Compared to Growth
Tax History
| Year | Tax Paid | Tax Assessment Tax Assessment Total Assessment is a certain percentage of the fair market value that is determined by local assessors to be the total taxable value of land and additions on the property. | Land | Improvement |
|---|---|---|---|---|
| 2024 | $1,279 | $72,600 | $0 | $0 |
| 2023 | $1,224 | $62,900 | $0 | $0 |
| 2022 | $3,471 | $53,800 | $0 | $0 |
| 2021 | $3,373 | $50,600 | $0 | $0 |
| 2020 | $2,762 | $46,300 | $0 | $0 |
| 2019 | $2,628 | $39,000 | $0 | $0 |
| 2018 | $600 | $33,600 | $0 | $0 |
| 2017 | $2,538 | $31,200 | $0 | $0 |
| 2016 | $1,847 | $32,100 | $0 | $0 |
| 2015 | $2,519 | $29,700 | $0 | $0 |
| 2013 | $2,440 | $24,900 | $0 | $0 |
| 2012 | $1,544 | $27,600 | $7,100 | $20,500 |
Source: Public Records
Map
Nearby Homes