Estimated Value: $159,237 - $179,000
3
Beds
1
Bath
1,528
Sq Ft
$112/Sq Ft
Est. Value
About This Home
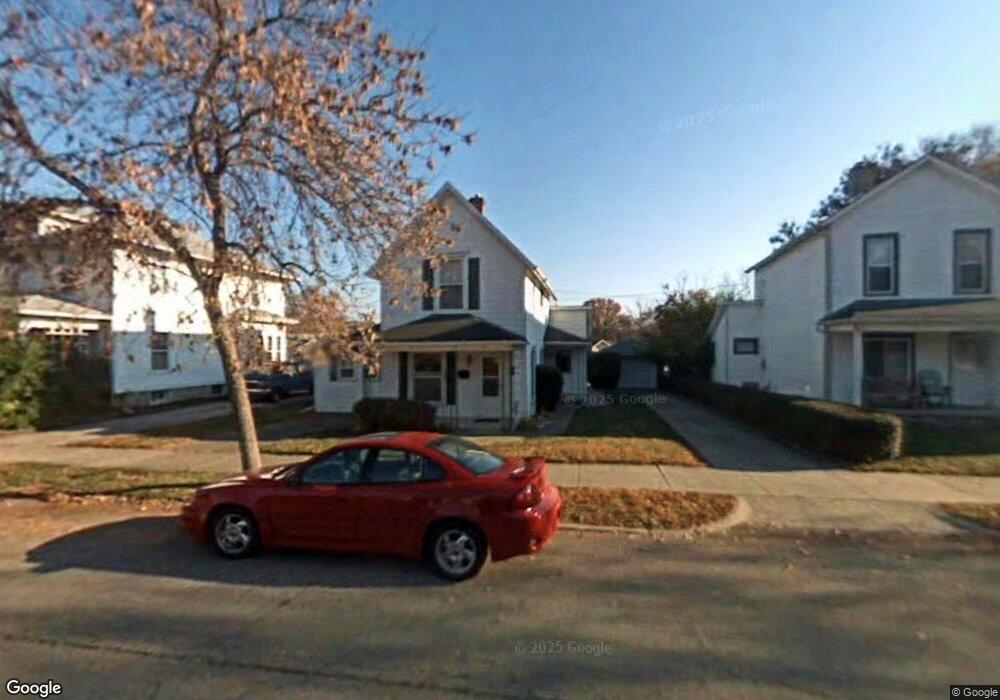
This home is located at 1137 Broadway, Piqua, OH 45356 and is currently estimated at $171,059, approximately $111 per square foot. 1137 Broadway is a home located in Miami County with nearby schools including Piqua Central Intermediate School, Springcreek Primary School, and Piqua Junior High School.
Ownership History
Date
Name
Owned For
Owner Type
Purchase Details
Closed on
Dec 23, 2014
Sold by
Robinaugh J Bruce and Robinaugh Lisa Ann
Bought by
Cromes Stevens D
Current Estimated Value
Home Financials for this Owner
Home Financials are based on the most recent Mortgage that was taken out on this home.
Original Mortgage
$53,021
Outstanding Balance
$41,820
Interest Rate
4.75%
Mortgage Type
FHA
Estimated Equity
$129,239
Purchase Details
Closed on
Jan 22, 2013
Sold by
Robinaugh Marcia A
Bought by
Robinaugh J Bruce and Robinaugh Robert J
Purchase Details
Closed on
Jul 21, 2011
Sold by
Robinaugh James E and Robinaugh Marcia A
Bought by
Robinaugh Marcia A
Purchase Details
Closed on
Jul 14, 2011
Sold by
Robinaugh James E and Robinaugh Marcia A
Bought by
Robinaugh Marcia A
Purchase Details
Closed on
Jan 1, 1990
Bought by
Robinaugh James E
Create a Home Valuation Report for This Property
The Home Valuation Report is an in-depth analysis detailing your home's value as well as a comparison with similar homes in the area
Home Values in the Area
Average Home Value in this Area
Purchase History
| Date | Buyer | Sale Price | Title Company |
|---|---|---|---|
| Cromes Stevens D | $54,000 | Springdale Title | |
| Robinaugh J Bruce | -- | None Available | |
| Robinaugh Marcia A | -- | -- | |
| Robinaugh Marcia A | -- | -- | |
| Robinaugh James E | -- | -- |
Source: Public Records
Mortgage History
| Date | Status | Borrower | Loan Amount |
|---|---|---|---|
| Open | Cromes Stevens D | $53,021 |
Source: Public Records
Tax History Compared to Growth
Tax History
| Year | Tax Paid | Tax Assessment Tax Assessment Total Assessment is a certain percentage of the fair market value that is determined by local assessors to be the total taxable value of land and additions on the property. | Land | Improvement |
|---|---|---|---|---|
| 2024 | $1,334 | $32,450 | $9,700 | $22,750 |
| 2023 | $1,334 | $32,450 | $9,700 | $22,750 |
| 2022 | $1,357 | $32,450 | $9,700 | $22,750 |
| 2021 | $1,141 | $24,960 | $7,460 | $17,500 |
| 2020 | $1,118 | $24,960 | $7,460 | $17,500 |
| 2019 | $1,124 | $24,960 | $7,460 | $17,500 |
| 2018 | $994 | $21,070 | $7,770 | $13,300 |
| 2017 | $1,006 | $21,070 | $7,770 | $13,300 |
| 2016 | $995 | $21,070 | $7,770 | $13,300 |
| 2015 | $555 | $20,240 | $7,460 | $12,780 |
| 2014 | $555 | $20,240 | $7,460 | $12,780 |
| 2013 | $557 | $20,240 | $7,460 | $12,780 |
Source: Public Records
Map
Nearby Homes
- 1135 Broadway
- 1139 Broadway
- 1133 Broadway
- 519 Riverside Dr
- 1201 Broadway
- 524 Riverside Dr
- 1121 Broadway
- 528 Riverside Dr
- 517 Riverside Dr
- 526 Riverside Dr
- 522 Riverside Dr
- 1138 Broadway
- 534 Riverside Dr
- 520 Riverside Dr
- 1117 Broadway
- 1136 Broadway
- 515 Riverside Dr
- 518 Riverside Dr
- 1122 Broadway
- 1115 Broadway