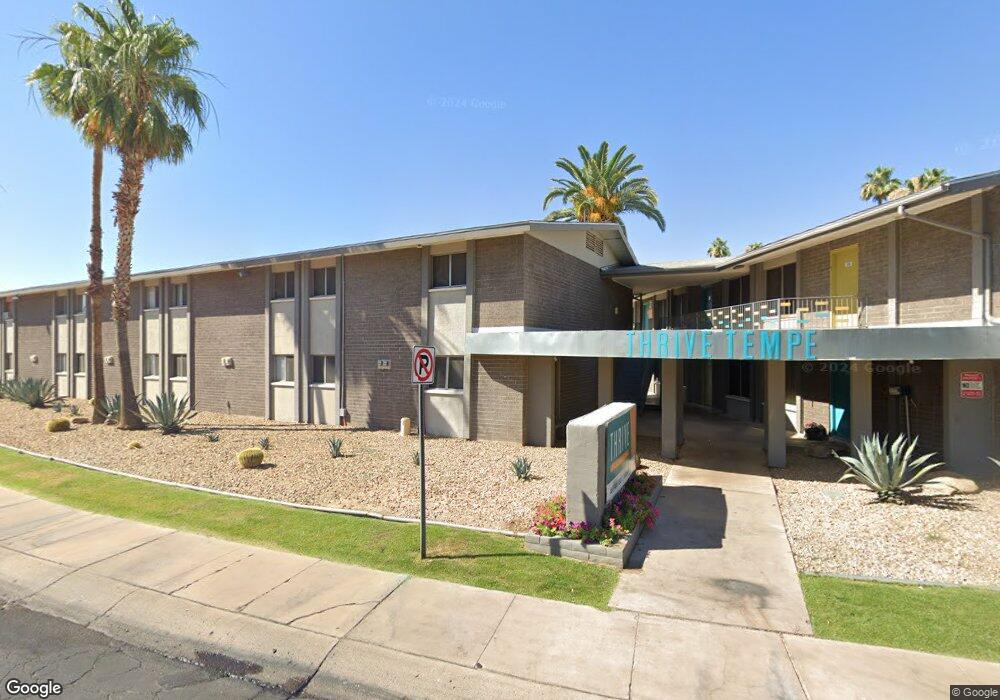
1137 E Orange St Tempe, AZ 85281
Downtown Tempe Neighborhood
2
Beds
--
Bath
965
Sq Ft
--
Built
About This Home
Experience vibrant living at Thrive Tempe Apartments in Tempe, AZ. Our pet-friendly community features a resort-style pool, on-site maintenance, and select homes with granite countertops and stainless steel appliances. Ideally located near ASU, Mill Avenue, and Tempe Marketplace, Thrive Tempe offers the perfect blend of comfort, convenience, and connection. Relax on your private patio or gather with friends at our BBQ areas—this is where your lifestyle thrives.
Create a Home Valuation Report for This Property
The Home Valuation Report is an in-depth analysis detailing your home's value as well as a comparison with similar homes in the area
Home Values in the Area
Average Home Value in this Area
Property History
| Date | Event | Price | List to Sale | Price per Sq Ft |
|---|---|---|---|---|
| 02/17/2024 02/17/24 | Price Changed | $1,095 | -17.7% | $1 / Sq Ft |
| 01/20/2024 01/20/24 | Price Changed | $1,330 | -6.7% | $2 / Sq Ft |
| 01/05/2024 01/05/24 | Price Changed | $1,425 | +30.1% | $2 / Sq Ft |
| 01/04/2024 01/04/24 | Price Changed | $1,095 | -23.2% | $1 / Sq Ft |
| 01/03/2024 01/03/24 | Price Changed | $1,425 | +11.8% | $2 / Sq Ft |
| 12/27/2023 12/27/23 | Price Changed | $1,275 | +16.4% | $2 / Sq Ft |
| 11/07/2023 11/07/23 | Price Changed | $1,095 | 0.0% | $1 / Sq Ft |
| 09/09/2023 09/09/23 | Price Changed | $1,095 | +93.1% | $1 / Sq Ft |
| 08/07/2023 08/07/23 | For Rent | -- | -- | -- |
| 07/03/2023 07/03/23 | Price Changed | $567 | 0.0% | $1 / Sq Ft |
| 07/02/2023 07/02/23 | Price Changed | $567 | 0.0% | $1 / Sq Ft |
| 06/30/2023 06/30/23 | Price Changed | $567 | 0.0% | $1 / Sq Ft |
| 06/28/2023 06/28/23 | Price Changed | $567 | 0.0% | $1 / Sq Ft |
| 06/22/2023 06/22/23 | Price Changed | $567 | 0.0% | $1 / Sq Ft |
| 06/21/2023 06/21/23 | For Rent | -- | -- | -- |
| 05/30/2023 05/30/23 | Price Changed | $567 | 0.0% | $1 / Sq Ft |
| 05/19/2023 05/19/23 | Price Changed | $567 | 0.0% | $1 / Sq Ft |
| 05/14/2023 05/14/23 | Price Changed | $567 | 0.0% | $1 / Sq Ft |
| 05/07/2023 05/07/23 | Price Changed | $567 | 0.0% | $1 / Sq Ft |
| 05/04/2023 05/04/23 | Price Changed | $567 | 0.0% | $1 / Sq Ft |
| 04/30/2023 04/30/23 | Price Changed | $567 | 0.0% | $1 / Sq Ft |
| 04/26/2023 04/26/23 | Price Changed | $567 | 0.0% | $1 / Sq Ft |
| 04/11/2023 04/11/23 | Price Changed | $567 | 0.0% | $1 / Sq Ft |
| 04/05/2023 04/05/23 | Price Changed | $567 | 0.0% | $1 / Sq Ft |
| 03/23/2023 03/23/23 | Price Changed | $567 | 0.0% | $1 / Sq Ft |
| 03/13/2023 03/13/23 | Price Changed | $567 | 0.0% | $1 / Sq Ft |
| 03/07/2023 03/07/23 | Price Changed | $567 | 0.0% | $1 / Sq Ft |
| 02/26/2023 02/26/23 | Price Changed | $567 | 0.0% | $1 / Sq Ft |
| 02/22/2023 02/22/23 | Price Changed | $567 | 0.0% | $1 / Sq Ft |
| 02/20/2023 02/20/23 | Price Changed | $567 | 0.0% | $1 / Sq Ft |
| 02/10/2023 02/10/23 | Price Changed | $567 | 0.0% | $1 / Sq Ft |
| 02/07/2023 02/07/23 | Price Changed | $567 | 0.0% | $1 / Sq Ft |
| 01/21/2023 01/21/23 | Price Changed | $567 | -56.4% | $1 / Sq Ft |
| 01/06/2023 01/06/23 | Price Changed | $1,300 | 0.0% | $2 / Sq Ft |
| 08/28/2022 08/28/22 | Price Changed | $1,300 | 0.0% | $2 / Sq Ft |
| 08/27/2022 08/27/22 | Price Changed | $1,300 | 0.0% | $2 / Sq Ft |
| 08/26/2022 08/26/22 | Price Changed | $1,300 | 0.0% | $2 / Sq Ft |
| 08/25/2022 08/25/22 | Price Changed | $1,300 | 0.0% | $2 / Sq Ft |
| 08/18/2022 08/18/22 | Price Changed | $1,300 | 0.0% | $2 / Sq Ft |
| 08/16/2022 08/16/22 | Price Changed | $1,300 | 0.0% | $2 / Sq Ft |
| 08/15/2022 08/15/22 | Price Changed | $1,300 | 0.0% | $2 / Sq Ft |
| 08/14/2022 08/14/22 | Price Changed | $1,300 | 0.0% | $2 / Sq Ft |
| 08/12/2022 08/12/22 | Price Changed | $1,300 | 0.0% | $2 / Sq Ft |
| 08/11/2022 08/11/22 | Price Changed | $1,300 | 0.0% | $2 / Sq Ft |
| 08/09/2022 08/09/22 | Price Changed | $1,300 | 0.0% | $2 / Sq Ft |
| 07/16/2022 07/16/22 | Price Changed | $1,300 | 0.0% | $2 / Sq Ft |
| 06/29/2022 06/29/22 | Price Changed | $1,300 | 0.0% | $2 / Sq Ft |
| 06/09/2022 06/09/22 | Price Changed | $1,300 | +205.9% | $2 / Sq Ft |
| 06/07/2022 06/07/22 | Price Changed | $425 | 0.0% | $1 / Sq Ft |
| 06/07/2022 06/07/22 | For Rent | $425 | -61.2% | -- |
| 05/18/2022 05/18/22 | For Rent | $1,095 | -- | -- |
Tax History
| Year | Tax Paid | Tax Assessment Tax Assessment Total Assessment is a certain percentage of the fair market value that is determined by local assessors to be the total taxable value of land and additions on the property. | Land | Improvement |
|---|---|---|---|---|
| 2025 | $37,388 | $311,932 | -- | -- |
| 2024 | $34,521 | $297,078 | -- | -- |
| 2023 | $34,521 | $830,120 | $168,700 | $661,420 |
| 2022 | $33,113 | $783,770 | $159,280 | $624,490 |
| 2021 | $33,342 | $662,180 | $134,570 | $527,610 |
| 2020 | $32,330 | $471,600 | $95,840 | $375,760 |
| 2019 | $31,717 | $423,130 | $85,990 | $337,140 |
| 2018 | $30,929 | $322,670 | $65,570 | $257,100 |
| 2017 | $30,008 | $301,700 | $61,310 | $240,390 |
| 2016 | $29,797 | $271,210 | $55,110 | $216,100 |
Source: Public Records
Map
Nearby Homes
- 1002 S Mariana St
- 1036 S Mariana St Unit 5
- 1215 E Lemon St Unit 208
- 1314 E Orange St
- 1005 E 8th St Unit 2003
- 1111 E University Dr Unit 239
- 1229 E Spence Ave
- 1418 S Newberry Ln
- 1427 S Newberry Ln
- 1433 S Rita Ln
- 917 E Spence Ave
- 1491 S Rita Ln
- 1622 E 12th St
- 1615 E Hudson Dr
- 1609 E Williams St
- 906 S Acapulco Ln Unit A
- 620 E Encanto Dr
- 834 S Casitas Dr Unit B
- 1871 E Hayden Ln Unit D
- 1445 E Broadway Rd Unit 115
- 1137 E Orange St
- 1015 S Stanley Place
- 0000 E Xxxxxxxxxxxxxx Dr
- 1150 E Orange St Unit 3
- 1150 E Orange St Unit 1002
- 1150 E Orange St Unit 1
- 1150 E Orange St Unit 4
- 1150 E Orange St
- 1224 E Lemon St
- 1224 E Lemon St
- 1002 S Mariana St Unit 4
- 1002 S Mariana St Unit 3
- 1002 S Mariana St Unit 2
- 1008 S Mariana St Unit 1
- 1008 S Mariana St
- 1008 S Mariana St Unit 3
- 1008 S Mariana St Unit 4
- 1008 S Mariana St Unit 2
- 1016 S Mariana St
- 1202 E Orange St
Your Personal Tour Guide
Ask me questions while you tour the home.