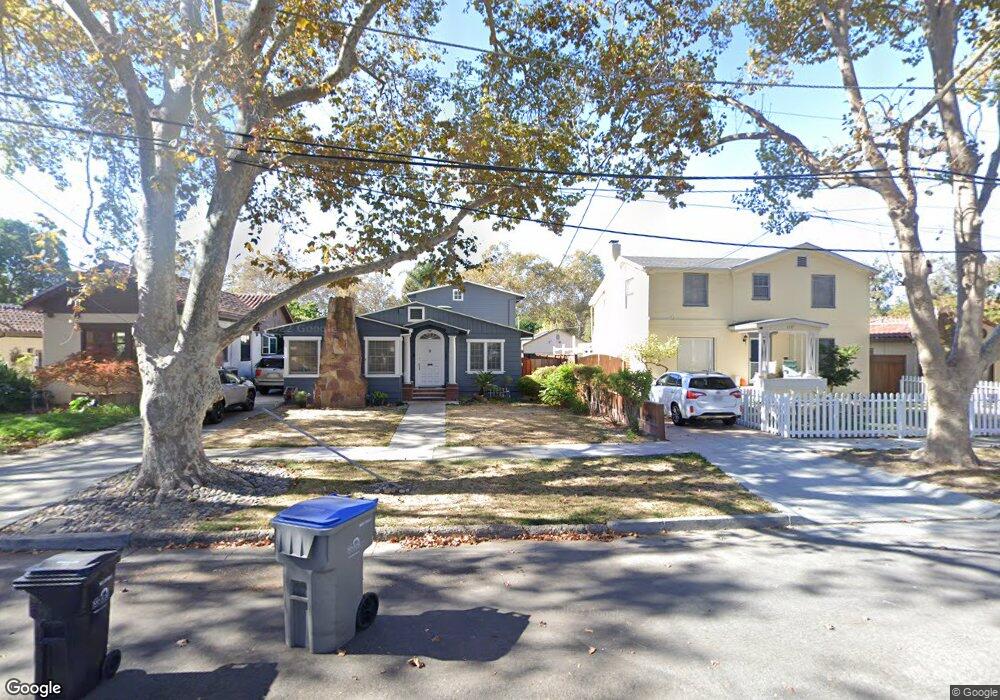
1137 N 3rd St Unit 1 San Jose, CA 95112
Hyde Park NeighborhoodEstimated Value: $1,176,000 - $1,555,000
3
Beds
3
Baths
2,312
Sq Ft
$618/Sq Ft
Est. Value
About This Home
This home is located at 1137 N 3rd St Unit 1, San Jose, CA 95112 and is currently estimated at $1,428,333, approximately $617 per square foot. 1137 N 3rd St Unit 1 is a home located in Santa Clara County with nearby schools including Muwekma Ohlone Middle, San Jose High School, and Walter L. Bachrodt Elementary School.
Ownership History
Date
Name
Owned For
Owner Type
Purchase Details
Closed on
May 17, 2019
Sold by
Robson Homes Llc
Bought by
Perry William G and Perry Elizabeth A
Current Estimated Value
Home Financials for this Owner
Home Financials are based on the most recent Mortgage that was taken out on this home.
Original Mortgage
$900,000
Outstanding Balance
$777,282
Interest Rate
4%
Mortgage Type
New Conventional
Estimated Equity
$651,051
Purchase Details
Closed on
Jul 7, 2016
Sold by
Deutsche Bank National Trust Company
Bought by
Ratchford Timothy P and Ratchford Elizabeth A
Home Financials for this Owner
Home Financials are based on the most recent Mortgage that was taken out on this home.
Original Mortgage
$550,000
Interest Rate
3.64%
Mortgage Type
Purchase Money Mortgage
Purchase Details
Closed on
Jan 25, 2016
Sold by
Thaxton Earl and Owens Margaret J
Bought by
Ratchford Timothy P and Ratchford Elizabeth A
Home Financials for this Owner
Home Financials are based on the most recent Mortgage that was taken out on this home.
Original Mortgage
$250,000
Interest Rate
3.93%
Mortgage Type
Stand Alone Second
Create a Home Valuation Report for This Property
The Home Valuation Report is an in-depth analysis detailing your home's value as well as a comparison with similar homes in the area
Home Values in the Area
Average Home Value in this Area
Purchase History
| Date | Buyer | Sale Price | Title Company |
|---|---|---|---|
| Perry William G | -- | First Amer Ttl Ins Co Ncs | |
| Ratchford Timothy P | -- | North American Title | |
| Ratchford Timothy P | -- | North American Title Co Inc |
Source: Public Records
Mortgage History
| Date | Status | Borrower | Loan Amount |
|---|---|---|---|
| Open | Perry William G | $900,000 | |
| Previous Owner | Ratchford Timothy P | $550,000 | |
| Previous Owner | Ratchford Timothy P | $250,000 |
Source: Public Records
Tax History Compared to Growth
Tax History
| Year | Tax Paid | Tax Assessment Tax Assessment Total Assessment is a certain percentage of the fair market value that is determined by local assessors to be the total taxable value of land and additions on the property. | Land | Improvement |
|---|---|---|---|---|
| 2025 | $14,456 | $1,090,055 | $899,682 | $190,373 |
| 2024 | $14,456 | $1,068,683 | $882,042 | $186,641 |
| 2023 | $14,149 | $1,047,730 | $864,748 | $182,982 |
| 2022 | $14,032 | $1,027,188 | $847,793 | $179,395 |
| 2021 | $12,809 | $929,597 | $831,170 | $98,427 |
| 2020 | $12,535 | $920,066 | $822,648 | $97,418 |
| 2019 | $12,262 | $902,026 | $806,518 | $95,508 |
| 2018 | $12,133 | $884,340 | $790,704 | $93,636 |
| 2017 | $12,026 | $867,000 | $775,200 | $91,800 |
| 2016 | $3,292 | $140,653 | $46,877 | $93,776 |
| 2015 | $4,259 | $138,541 | $46,173 | $92,368 |
| 2014 | -- | $135,828 | $45,269 | $90,559 |
Source: Public Records
Map
Nearby Homes
- 115 Burton Ave
- 1107 N 4th St
- 1421 N 1st St Unit 251
- 800 N 8th St Unit 120
- 800 N 8th St Unit 311
- 800 N 8th St Unit 207
- 1550 Technology Dr Unit 2112
- 1550 Technology Dr Unit 1072
- 1550 Technology Dr Unit 2005
- 494 Madera Ave
- 520 Madera Ave
- 1025 N 12th St
- 350 E Mission St Unit 211
- 350 E Mission St Unit 115
- 0 E Hedding St
- 748-3 N 10th St
- 647 N 2nd St
- 622 Berryessa Rd
- 640 N 2nd St
- 35 George St
- 1137 N 3rd St Unit 4
- 1137 N 3rd St Unit A
- 1137 N 3rd St
- 1137 N 3rd St Unit 2
- 1137 N 3rd St Unit 3
- 1137 N 3rd St Unit B
- 1135 N 3rd St
- 1141 N 3rd St
- 1139 N 3rd St Unit 2
- 1131 N 3rd St
- 1127 N 3rd St
- 1140 N 2nd St
- 1144 N 2nd St
- 1136 N 2nd St
- 1130 N 2nd St
- 95 Burton Ave
- 1144 N 3rd St
- 1142 N 3rd St
- 1148 N 3rd St
- 1126 N 2nd St