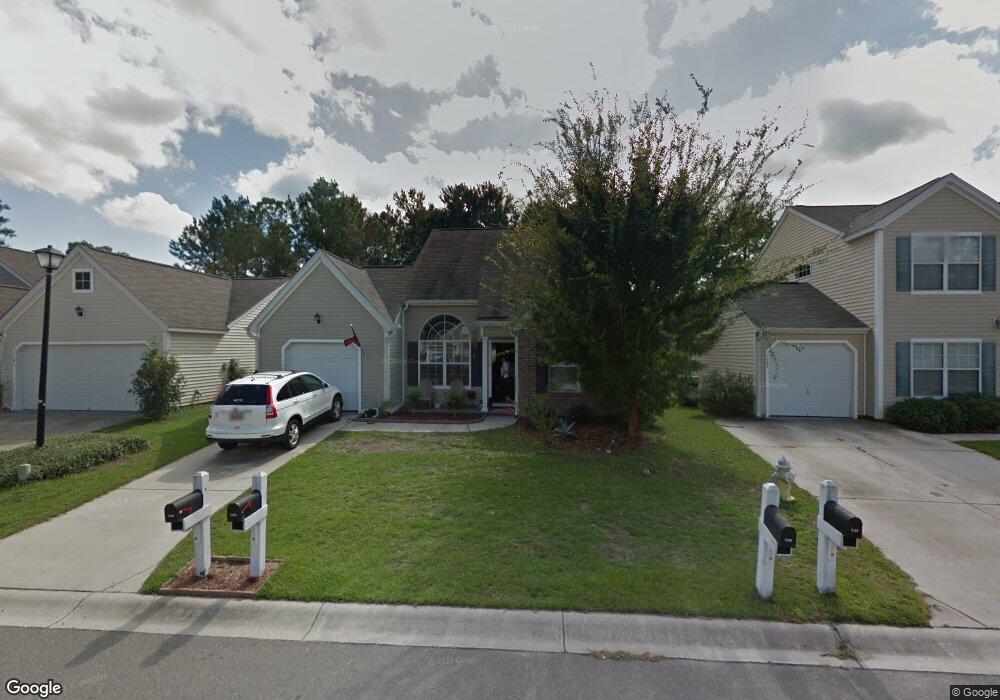
1137 River Bay Ln Charleston, SC 29492
Wando NeighborhoodEstimated Value: $455,232 - $505,000
2
Beds
2
Baths
1,340
Sq Ft
$353/Sq Ft
Est. Value
About This Home
This home is located at 1137 River Bay Ln, Charleston, SC 29492 and is currently estimated at $472,808, approximately $352 per square foot. 1137 River Bay Ln is a home located in Berkeley County.
Ownership History
Date
Name
Owned For
Owner Type
Purchase Details
Closed on
May 28, 2010
Sold by
Butler Jack R
Bought by
Butler Daniel and Butler Robert
Current Estimated Value
Home Financials for this Owner
Home Financials are based on the most recent Mortgage that was taken out on this home.
Original Mortgage
$153,225
Outstanding Balance
$102,943
Interest Rate
5.02%
Mortgage Type
VA
Estimated Equity
$369,865
Purchase Details
Closed on
Sep 18, 2008
Sold by
Hemachandran Bharath K
Bought by
Butler Jack R
Purchase Details
Closed on
Nov 28, 2005
Sold by
Wiggins Gordon K and Wiggins Theresa K
Bought by
Hemachandran Bharath K
Home Financials for this Owner
Home Financials are based on the most recent Mortgage that was taken out on this home.
Original Mortgage
$180,314
Interest Rate
6.04%
Mortgage Type
FHA
Purchase Details
Closed on
Sep 30, 2003
Sold by
D R Horton Inc
Bought by
Wiggins Gordon K and Wiggins Theresa K
Create a Home Valuation Report for This Property
The Home Valuation Report is an in-depth analysis detailing your home's value as well as a comparison with similar homes in the area
Home Values in the Area
Average Home Value in this Area
Purchase History
| Date | Buyer | Sale Price | Title Company |
|---|---|---|---|
| Butler Daniel | $150,000 | -- | |
| Butler Jack R | $185,000 | -- | |
| Hemachandran Bharath K | $187,000 | None Available | |
| Wiggins Gordon K | $131,015 | -- |
Source: Public Records
Mortgage History
| Date | Status | Borrower | Loan Amount |
|---|---|---|---|
| Open | Butler Daniel | $153,225 | |
| Previous Owner | Hemachandran Bharath K | $180,314 |
Source: Public Records
Tax History Compared to Growth
Tax History
| Year | Tax Paid | Tax Assessment Tax Assessment Total Assessment is a certain percentage of the fair market value that is determined by local assessors to be the total taxable value of land and additions on the property. | Land | Improvement |
|---|---|---|---|---|
| 2025 | $1,438 | $212,129 | $59,923 | $152,206 |
| 2024 | $1,438 | $8,485 | $2,397 | $6,088 |
| 2023 | $1,438 | $8,485 | $2,397 | $6,088 |
| 2022 | $1,322 | $7,378 | $2,278 | $5,100 |
| 2021 | $3,775 | $7,380 | $2,278 | $5,100 |
| 2020 | $1,371 | $7,378 | $2,278 | $5,100 |
| 2019 | $1,396 | $7,378 | $2,278 | $5,100 |
| 2018 | $1,225 | $6,416 | $1,800 | $4,616 |
| 2017 | $1,223 | $6,416 | $1,800 | $4,616 |
| 2016 | $1,240 | $6,420 | $1,800 | $4,620 |
| 2015 | $1,162 | $6,420 | $1,800 | $4,620 |
| 2014 | $1,160 | $6,420 | $1,800 | $4,620 |
| 2013 | -- | $6,420 | $1,800 | $4,620 |
Source: Public Records
Map
Nearby Homes
- 1126 Peninsula Cove Dr
- 237 Nelliefield Creek Dr
- 1436 Water Edge Dr
- 308 Tidal Rice Ct
- 214 Rice Mill Place
- 420 Nelliefield Trail
- 213 Ashmont Dr
- 1295 Island Club Dr Unit C
- 1002 Marsh Grass Way Unit B
- 1316 Island Club Dr Unit A
- 1344 Palm Cove Dr
- 352 Cypress Walk Way
- 117 Wando Reach Rd
- 1185 Rivers Reach Dr
- 133 Wando Reach Rd
- 117 Carriage Hill Place
- 141 Wando Reach Rd
- 142 Wando Reach Rd
- 488 Nelliefield Trail
- 1019 Jervey Point Rd
- 1137 River Bay Dr
- 1141 River Bay Ln
- 1141 River Bay Dr
- 1133 River Bay Dr
- 1133 River Bay Ln
- 1145 River Bay Dr
- 1145 River Bay Ln
- 1129 River Bay Dr
- 1112 Waters Inlet Cir
- 1110 Waters Inlet Cir
- 1116 Waters Inlet Cir
- 1149 River Bay Dr
- 1149 River Bay Ln
- 1125 River Bay Ln
- 1125 River Bay Dr
- 1140 River Bay Dr
- 1200 Palm Cove Dr
- 1108 Waters Inlet Cir
- 1136 River Bay Ln
- 1140 River Bay Ln