D
Landlord's Agent in 2022
Dennis Strobehn
Marsh Management & Real Estate
(480) 345-1590
12 Total Sales


Estimated Value: $362,685 - $402,000
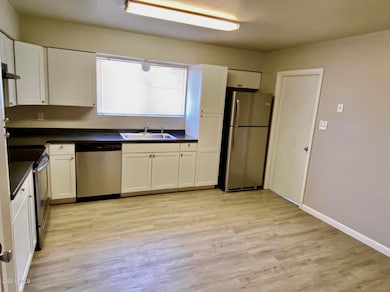
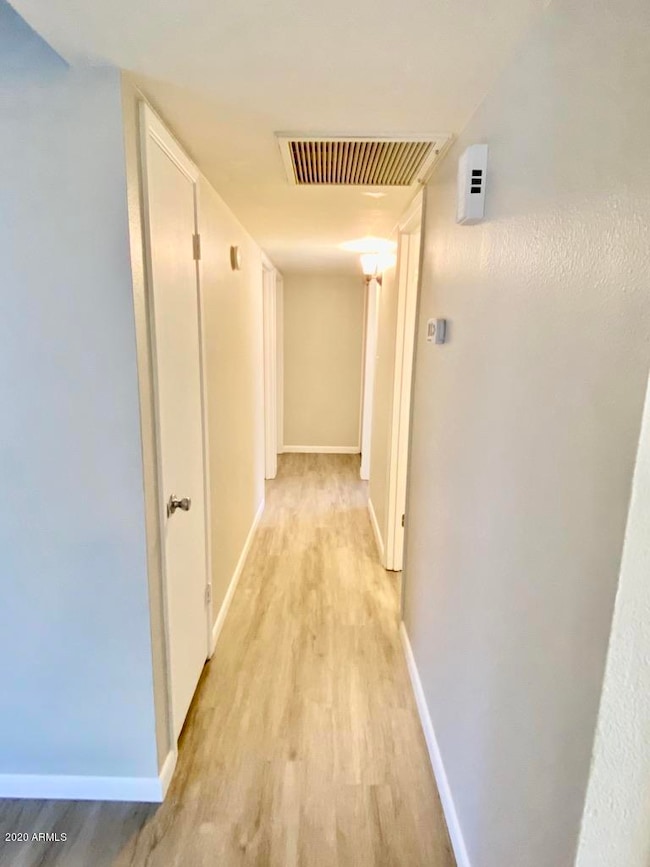
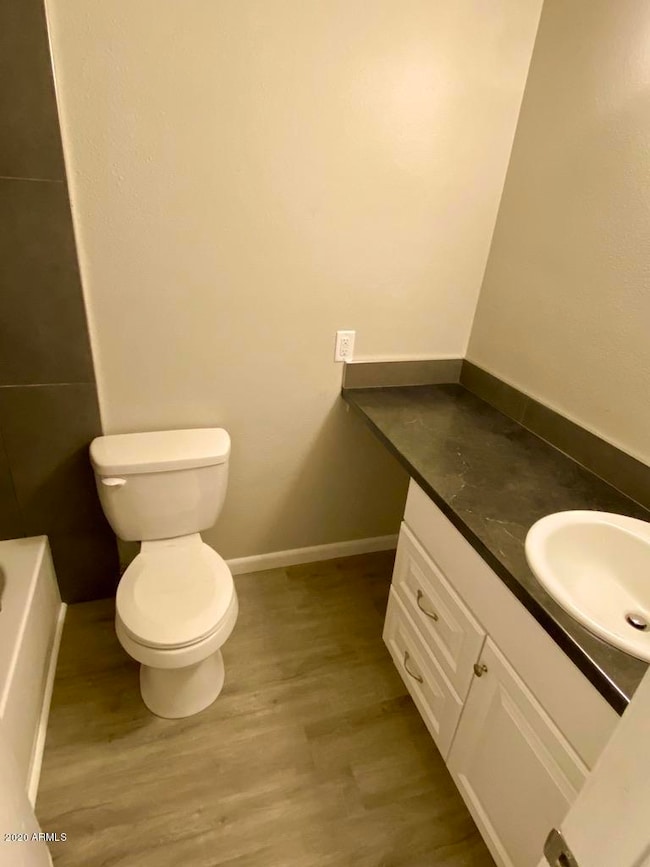
This 3 bedroom 2 bath home has new interior paint (July 2022)! Large eat-in kitchen with stainless steel appliances, refrigerator, living room across the front, nice size bedrooms, updated engineered wood look flooring throughout (no carpet), huge backyard, turf & desert landscaping & 2 car carport. 1 small dog may be approved (no cats please). No smoking or vaping of any kind please. Security deposit will equal at least one month's rent. Sales tax will apply to monthly rent. Tenants must provide proof of Renter's Insurance prior to moving in.
Last Agent to Rent the Property
Marsh Management & Real Estate License #BR633824000 Listed on: 07/27/2022
| Date | Buyer | Sale Price | Title Company |
|---|---|---|---|
| 1137 W Hackamore St Llc | -- | None Listed On Document | |
| 1137 W Hackamore St Llc | -- | None Listed On Document | |
| Johnson Ted | $226,000 | Fidelity Natl Ttl Agcy Inc |
| Date | Event | Price | List to Sale | Price per Sq Ft | Prior Sale |
|---|---|---|---|---|---|
| 08/15/2022 08/15/22 | Rented | $1,995 | 0.0% | -- | |
| 07/27/2022 07/27/22 | For Rent | $1,995 | +35.3% | -- | |
| 06/15/2020 06/15/20 | Rented | $1,475 | 0.0% | -- | |
| 06/02/2020 06/02/20 | For Rent | $1,475 | 0.0% | -- | |
| 03/24/2020 03/24/20 | Sold | $231,000 | -2.1% | $193 / Sq Ft | View Prior Sale |
| 02/22/2020 02/22/20 | Pending | -- | -- | -- | |
| 02/19/2020 02/19/20 | For Sale | $236,000 | 0.0% | $197 / Sq Ft | |
| 03/01/2019 03/01/19 | Rented | $1,195 | 0.0% | -- | |
| 02/04/2019 02/04/19 | For Rent | $1,195 | +15.5% | -- | |
| 02/15/2016 02/15/16 | Rented | $1,035 | 0.0% | -- | |
| 01/28/2016 01/28/16 | For Rent | $1,035 | +15.6% | -- | |
| 05/01/2013 05/01/13 | Rented | $895 | 0.0% | -- | |
| 04/26/2013 04/26/13 | Under Contract | -- | -- | -- | |
| 02/11/2013 02/11/13 | For Rent | $895 | -- | -- |
| Year | Tax Paid | Tax Assessment Tax Assessment Total Assessment is a certain percentage of the fair market value that is determined by local assessors to be the total taxable value of land and additions on the property. | Land | Improvement |
|---|---|---|---|---|
| 2025 | $1,098 | $11,134 | -- | -- |
| 2024 | $1,102 | $10,604 | -- | -- |
| 2023 | $1,102 | $25,150 | $5,030 | $20,120 |
| 2022 | $1,079 | $19,620 | $3,920 | $15,700 |
| 2021 | $1,092 | $17,420 | $3,480 | $13,940 |
| 2020 | $1,078 | $16,480 | $3,290 | $13,190 |
| 2019 | $1,007 | $14,220 | $2,840 | $11,380 |
| 2018 | $967 | $12,970 | $2,590 | $10,380 |
| 2017 | $938 | $12,260 | $2,450 | $9,810 |
| 2016 | $920 | $10,930 | $2,180 | $8,750 |
| 2015 | $865 | $9,050 | $1,810 | $7,240 |
D
Landlord's Agent in 2022
Dennis Strobehn
Marsh Management & Real Estate
(480) 345-1590
12 Total Sales

Tenant's Agent in 2022
Susan Earles
LRA Real Estate Group, LLC
(602) 509-4835
26 Total Sales
Buyer's Agent in 2020
Mike Schude
Instasold
(480) 201-9593
1 in this area
236 Total Sales
T
Buyer's Agent in 2016
Teresa Szewaga
48 Venture Real Estate
Source: Arizona Regional Multiple Listing Service (ARMLS)
MLS Number: 6440598
APN: 135-14-051
Disclaimer: Certain information contained herein is derived from information provided by parties other than Homes.com. All information provided is deemed reliable, but is not guaranteed to be accurate and should be independently verified.
![]() All information should be verified by the recipient and none is guaranteed as accurate by ARMLS
All information should be verified by the recipient and none is guaranteed as accurate by ARMLS
Listing Information presented by local MLS brokerage: Ten-X, local REALTOR®- Arlene Richardson - (888)-952-6393
Ask me questions while you tour the home.