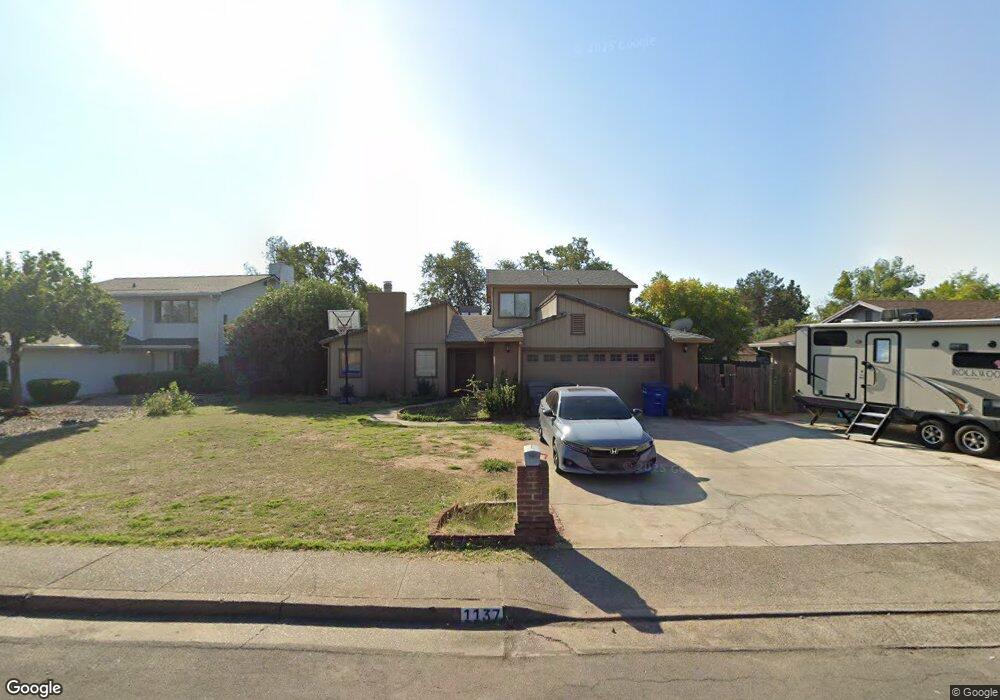
1137 Woodside Meadows Rd Redding, CA 96002
Mistletoe NeighborhoodEstimated Value: $323,796 - $420,000
3
Beds
2
Baths
1,620
Sq Ft
$227/Sq Ft
Est. Value
About This Home
This home is located at 1137 Woodside Meadows Rd, Redding, CA 96002 and is currently estimated at $367,449, approximately $226 per square foot. 1137 Woodside Meadows Rd is a home located in Shasta County with nearby schools including Mistletoe Elementary School, Enterprise High School, and Trinity Lutheran School.
Ownership History
Date
Name
Owned For
Owner Type
Purchase Details
Closed on
Jun 15, 2004
Sold by
Saechao Mouang
Bought by
Saechao Low and Saechao Mouang
Current Estimated Value
Home Financials for this Owner
Home Financials are based on the most recent Mortgage that was taken out on this home.
Original Mortgage
$177,600
Outstanding Balance
$84,848
Interest Rate
5.77%
Mortgage Type
Purchase Money Mortgage
Estimated Equity
$282,601
Purchase Details
Closed on
May 10, 2004
Sold by
Saechao Low C
Bought by
Saechao Mouang
Home Financials for this Owner
Home Financials are based on the most recent Mortgage that was taken out on this home.
Original Mortgage
$177,600
Outstanding Balance
$84,848
Interest Rate
5.77%
Mortgage Type
Purchase Money Mortgage
Estimated Equity
$282,601
Create a Home Valuation Report for This Property
The Home Valuation Report is an in-depth analysis detailing your home's value as well as a comparison with similar homes in the area
Home Values in the Area
Average Home Value in this Area
Purchase History
| Date | Buyer | Sale Price | Title Company |
|---|---|---|---|
| Saechao Low | -- | Alliance Title Company | |
| Saechao Mouang | -- | Alliance Title Company | |
| Saechao Mouang | $222,000 | Alliance Title Company |
Source: Public Records
Mortgage History
| Date | Status | Borrower | Loan Amount |
|---|---|---|---|
| Open | Saechao Mouang | $177,600 |
Source: Public Records
Tax History
| Year | Tax Paid | Tax Assessment Tax Assessment Total Assessment is a certain percentage of the fair market value that is determined by local assessors to be the total taxable value of land and additions on the property. | Land | Improvement |
|---|---|---|---|---|
| 2025 | $3,427 | $315,619 | $85,298 | $230,321 |
| 2024 | $3,379 | $309,431 | $83,626 | $225,805 |
| 2023 | $3,379 | $303,365 | $81,987 | $221,378 |
| 2022 | $3,284 | $297,418 | $80,380 | $217,038 |
| 2021 | $3,097 | $291,587 | $78,804 | $212,783 |
| 2020 | $2,503 | $235,000 | $45,000 | $190,000 |
| 2019 | $2,313 | $215,000 | $45,000 | $170,000 |
| 2018 | $2,110 | $195,000 | $45,000 | $150,000 |
| 2017 | $2,132 | $190,000 | $45,000 | $145,000 |
| 2016 | $1,925 | $180,000 | $40,000 | $140,000 |
| 2015 | $1,883 | $175,000 | $35,000 | $140,000 |
| 2014 | $1,795 | $165,000 | $30,000 | $135,000 |
Source: Public Records
Map
Nearby Homes
- 1750 Hawthorne Ct
- 1285 Lancers Ln
- 1939 Cameo Ct
- 1110 Grouse Dr
- 1088 Burton Dr
- 1461 Oakdale Ln
- 2100 Deerfield Ave
- 1928 Bechelli Ln
- 1968 Bechelli Ln
- 2093 Victor Ave
- 825 Mission Sierra Ct
- 1026 Palisades Ave
- 856 Mission de Oro Dr
- 771 Flower Ash Ln
- 1865 Dellwood Dr
- 1701 E Cypress Ave
- 724 Oakhurst Trail
- 775 Stonebriar Trail
- 965 Willow Brook Ln
- 720 Stonebriar Trail
- 1137 Woodside Meadows Dr
- 1161 Woodside Meadows Dr
- 1100 Pinewood Ct
- 1109 Woodside Meadows Dr
- 1189 Woodside Meadows Rd
- 1111 Pinewood Ct
- 1189 Woodside Meadows Dr
- 1100 Woodside Meadows Dr
- 1177 Pinewood Ct Unit 1
- 1177 Pinewood Ct
- 1191 Pinewood Ct
- 1093 Woodside Meadows Dr
- 1197 Woodside Meadows Dr
- 1648 Pinewood Dr Unit 1
- 1648 Pinewood Dr
- 1197 Woodside Meadows Rd
- 1093 Woodside Meadows Rd
- 1208 Hawthorne Ave
- 1080 Woodside Meadows Dr
- 1216 Hawthorne Ave
Your Personal Tour Guide
Ask me questions while you tour the home.