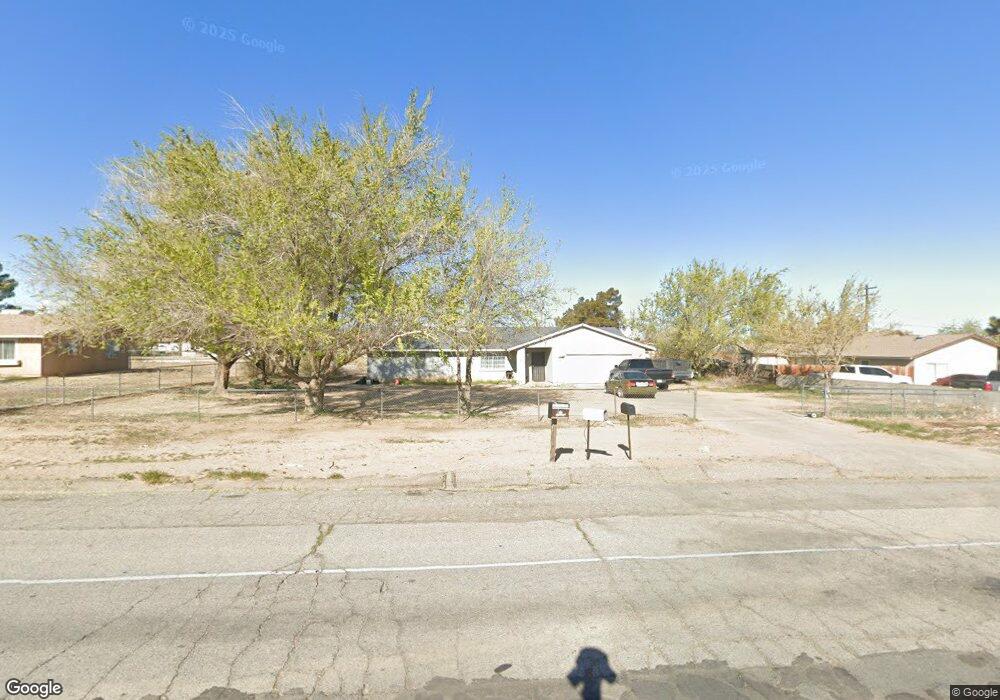
11370 Maple Ave Hesperia, CA 92345
Estimated Value: $386,000 - $439,000
3
Beds
2
Baths
1,617
Sq Ft
$258/Sq Ft
Est. Value
About This Home
This home is located at 11370 Maple Ave, Hesperia, CA 92345 and is currently estimated at $416,951, approximately $257 per square foot. 11370 Maple Ave is a home located in San Bernardino County with nearby schools including Maple Elementary School, Hesperia Junior High School, and Hesperia High School.
Ownership History
Date
Name
Owned For
Owner Type
Purchase Details
Closed on
Sep 30, 2015
Sold by
Blp Services Llc
Bought by
Vergara Giovanni and Vergara Andrea
Current Estimated Value
Home Financials for this Owner
Home Financials are based on the most recent Mortgage that was taken out on this home.
Original Mortgage
$154,761
Interest Rate
3.87%
Mortgage Type
FHA
Purchase Details
Closed on
Dec 23, 2013
Sold by
United Services Inc
Bought by
Blp Services Llc
Purchase Details
Closed on
Jun 2, 2010
Sold by
Federal Home Loan Mortgage Corporation
Bought by
United Services Inc
Purchase Details
Closed on
Dec 15, 2009
Sold by
Schliebe Paul D and Schliebe Otilia L
Bought by
Federal Home Loan Mortgage Corporation
Create a Home Valuation Report for This Property
The Home Valuation Report is an in-depth analysis detailing your home's value as well as a comparison with similar homes in the area
Purchase History
We collect this data history from publicly available records. To have your information removed, we recommend requesting removal directly through your county’s website.
| Date | Buyer | Sale Price | Title Company |
|---|---|---|---|
| Vergara Giovanni | $169,000 | Chicago Title Company | |
| Blp Services Llc | $71,000 | First American Title Company | |
| United Services Inc | $70,000 | Lsi Title | |
| Federal Home Loan Mortgage Corporation | $99,296 | Accommodation |
Source: Public Records
Mortgage History
We collect this data history from publicly available records. To have your information removed, we recommend requesting removal directly through your county’s website.
| Date | Status | Borrower | Loan Amount |
|---|---|---|---|
| Previous Owner | Vergara Giovanni | $154,761 |
Source: Public Records
Tax History
| Year | Tax Paid | Tax Assessment Tax Assessment Total Assessment is a certain percentage of the fair market value that is determined by local assessors to be the total taxable value of land and additions on the property. | Land | Improvement |
|---|---|---|---|---|
| 2025 | $2,259 | $200,061 | $40,012 | $160,049 |
| 2024 | $2,806 | $196,138 | $39,227 | $156,911 |
| 2023 | $2,184 | $192,292 | $38,458 | $153,834 |
| 2022 | $2,134 | $188,522 | $37,704 | $150,818 |
| 2021 | $2,519 | $184,826 | $36,965 | $147,861 |
| 2020 | $3,338 | $182,931 | $36,586 | $146,345 |
| 2019 | $2,029 | $179,344 | $35,869 | $143,475 |
| 2018 | $1,991 | $175,828 | $35,166 | $140,662 |
| 2017 | $1,956 | $172,380 | $34,476 | $137,904 |
| 2016 | $1,641 | $143,940 | $28,995 | $114,945 |
| 2015 | $1,620 | $141,777 | $28,559 | $113,218 |
| 2014 | $886 | $73,709 | $22,113 | $51,596 |
Source: Public Records
Map
Nearby Homes
- 11363 Maple Ave
- 11441 Hemlock Ave
- 11558 Hemlock Ave
- 11546 Oakwood Ave
- 0 Boxwood Ave Unit OC25272491
- 0 Birch Unit V1-33771
- 11744 Cottonwood Ave
- 11918 Hemlock Ave
- 0 Veterans' Memorial Hwy
- 14637 Sequoia Ave
- 13857 Raven St
- 11550 Halter St
- 13833 Raven St
- 10687 Maple Ave
- 0 Sequoia St Unit HD26041361
- 0 Sequoia St Unit IV25175828
- 10760 Morgan Ct
- 0 Mesa St Unit CV26089451
- 0 Mesa St Unit HD26105740
- 0 Mesa St Unit HD25146689
- 11388 Maple Ave
- 11350 Maple Ave
- 11367 Shangri la Ave
- 11385 Shangri la Ave
- 11353 Shangri la Ave
- 11406 Maple Ave
- 11330 Maple Ave
- 11409 Shangri la Ave
- 11327 Shangri la Ave
- 11383 Maple Ave
- 11424 Maple Ave
- 11316 Maple Ave
- 11370 Shangri la Ave
- 11388 Shangri la Ave
- 11350 Shangri la Ave
- 11427 Shangri la Ave
- 11319 Shangri la Ave
- 14524 Eucalyptus St
- 11406 Shangri la Ave
- 11417 Maple Ave
Your Personal Tour Guide
Ask me questions while you tour the home.