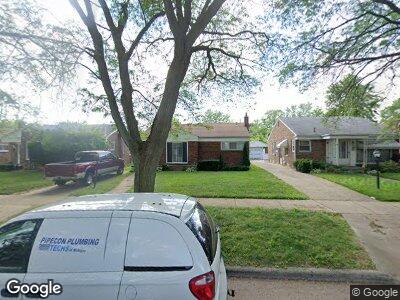
11375 Wormer Unit Bldg-Unit Redford, MI 48239
Estimated Value: $165,000 - $199,000
--
Bed
1
Bath
970
Sq Ft
$185/Sq Ft
Est. Value
About This Home
This home is located at 11375 Wormer Unit Bldg-Unit, Redford, MI 48239 and is currently estimated at $179,168, approximately $184 per square foot. 11375 Wormer Unit Bldg-Unit is a home located in Wayne County with nearby schools including John D. Pierce Middle School, Lee M. Thurston High School, and Detroit Leadership Academy.
Ownership History
Date
Name
Owned For
Owner Type
Purchase Details
Closed on
Aug 5, 2019
Sold by
The Gordon Realty Group Llc
Bought by
Richard Leslie
Current Estimated Value
Home Financials for this Owner
Home Financials are based on the most recent Mortgage that was taken out on this home.
Original Mortgage
$105,725
Outstanding Balance
$93,986
Interest Rate
3.7%
Mortgage Type
VA
Estimated Equity
$84,179
Purchase Details
Closed on
Jun 20, 2018
Sold by
Deutsche Bank National Trust Company
Bought by
The Gordon Realty Group Llc
Purchase Details
Closed on
Feb 1, 2018
Sold by
Graves James R
Bought by
Deutsche Bank National Trust Co
Purchase Details
Closed on
Oct 25, 2001
Sold by
B S T Investment & Realt
Bought by
Graves James R
Purchase Details
Closed on
Mar 12, 2001
Sold by
Schren James P
Bought by
B S T Investment & Realty C
Purchase Details
Closed on
Dec 6, 2000
Sold by
James P Schren
Bought by
Bank One
Create a Home Valuation Report for This Property
The Home Valuation Report is an in-depth analysis detailing your home's value as well as a comparison with similar homes in the area
Home Values in the Area
Average Home Value in this Area
Purchase History
| Date | Buyer | Sale Price | Title Company |
|---|---|---|---|
| Richard Leslie | $103,500 | Peak Title Agency Co | |
| The Gordon Realty Group Llc | $81,000 | Premium Title Svcs Inc | |
| Deutsche Bank National Trust Co | $78,300 | None Available | |
| Graves James R | -- | -- | |
| B S T Investment & Realty C | $88,200 | -- | |
| Bank One | $79,990 | -- |
Source: Public Records
Mortgage History
| Date | Status | Borrower | Loan Amount |
|---|---|---|---|
| Open | Richard Leslie | $105,725 |
Source: Public Records
Tax History Compared to Growth
Tax History
| Year | Tax Paid | Tax Assessment Tax Assessment Total Assessment is a certain percentage of the fair market value that is determined by local assessors to be the total taxable value of land and additions on the property. | Land | Improvement |
|---|---|---|---|---|
| 2024 | $1,273 | $76,400 | $0 | $0 |
| 2023 | $1,219 | $66,500 | $0 | $0 |
| 2022 | $3,457 | $57,100 | $0 | $0 |
| 2021 | $3,360 | $53,900 | $0 | $0 |
| 2020 | $3,312 | $49,700 | $0 | $0 |
| 2019 | $3,305 | $43,500 | $0 | $0 |
| 2018 | $980 | $37,200 | $0 | $0 |
| 2017 | $2,973 | $34,800 | $0 | $0 |
| 2016 | $2,446 | $35,900 | $0 | $0 |
| 2015 | $2,967 | $33,500 | $0 | $0 |
| 2013 | $3,280 | $33,700 | $0 | $0 |
| 2012 | $3,014 | $36,000 | $7,100 | $28,900 |
Source: Public Records
Map
Nearby Homes