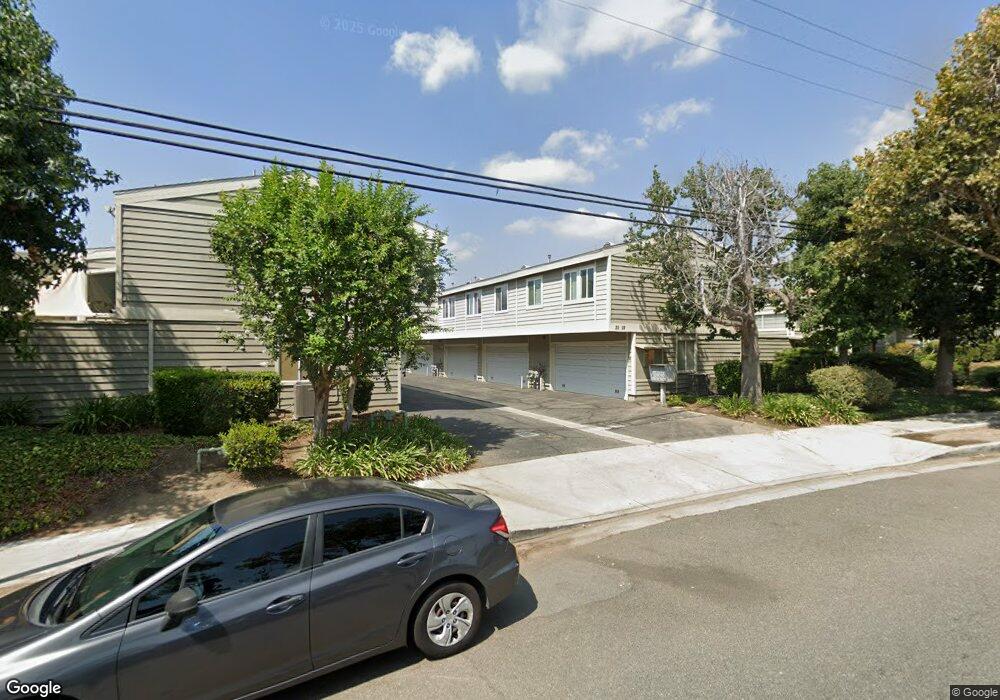
11377 Osborne Place Unit 32 Sylmar, CA 91342
Estimated Value: $496,115 - $547,000
2
Beds
3
Baths
922
Sq Ft
$562/Sq Ft
Est. Value
About This Home
This home is located at 11377 Osborne Place Unit 32, Sylmar, CA 91342 and is currently estimated at $518,279, approximately $562 per square foot. 11377 Osborne Place Unit 32 is a home located in Los Angeles County with nearby schools including Brainard Elementary School, Charles Maclay Middle School, and Mt. Gleason Middle School.
Ownership History
Date
Name
Owned For
Owner Type
Purchase Details
Closed on
Oct 24, 2013
Sold by
Wilbur Joseph W and Wilbur James Leslie
Bought by
Wilbur Joseph W and Wilbur James Leslie
Current Estimated Value
Home Financials for this Owner
Home Financials are based on the most recent Mortgage that was taken out on this home.
Original Mortgage
$110,500
Outstanding Balance
$29,093
Interest Rate
4.46%
Mortgage Type
New Conventional
Estimated Equity
$489,186
Purchase Details
Closed on
Oct 29, 2001
Sold by
Fournier Christine and Fournier Michel A
Bought by
Wilbur Joseph W and Wilbur James Leslie
Home Financials for this Owner
Home Financials are based on the most recent Mortgage that was taken out on this home.
Original Mortgage
$129,000
Interest Rate
6.57%
Mortgage Type
FHA
Purchase Details
Closed on
Dec 14, 1993
Sold by
Fournier Christine and Fournier Michel A
Bought by
Fournier Christine and Fournier Michel A
Create a Home Valuation Report for This Property
The Home Valuation Report is an in-depth analysis detailing your home's value as well as a comparison with similar homes in the area
Home Values in the Area
Average Home Value in this Area
Purchase History
| Date | Buyer | Sale Price | Title Company |
|---|---|---|---|
| Wilbur Joseph W | -- | Tsi Title Company Of Ca Inc | |
| Wilbur Joseph W | $133,000 | Southland Title | |
| Fournier Christine | -- | Investors Title |
Source: Public Records
Mortgage History
| Date | Status | Borrower | Loan Amount |
|---|---|---|---|
| Open | Wilbur Joseph W | $110,500 | |
| Closed | Wilbur Joseph W | $129,000 |
Source: Public Records
Tax History Compared to Growth
Tax History
| Year | Tax Paid | Tax Assessment Tax Assessment Total Assessment is a certain percentage of the fair market value that is determined by local assessors to be the total taxable value of land and additions on the property. | Land | Improvement |
|---|---|---|---|---|
| 2025 | $2,496 | $196,456 | $61,444 | $135,012 |
| 2024 | $2,496 | $192,605 | $60,240 | $132,365 |
| 2023 | $2,450 | $188,829 | $59,059 | $129,770 |
| 2022 | $2,338 | $185,127 | $57,901 | $127,226 |
| 2021 | $2,306 | $181,498 | $56,766 | $124,732 |
| 2019 | $2,239 | $176,117 | $55,083 | $121,034 |
| 2018 | $2,201 | $172,664 | $54,003 | $118,661 |
| 2016 | $2,096 | $165,961 | $51,907 | $114,054 |
| 2015 | $2,067 | $163,469 | $51,128 | $112,341 |
| 2014 | $2,081 | $160,268 | $50,127 | $110,141 |
Source: Public Records
Map
Nearby Homes
- 11377 Osborne Place Unit 34
- 11350 Foothill Blvd Unit 15
- 11350 Foothill Blvd Unit 30
- 11300 Foothill Blvd Unit 30
- 11569 Bonham Ave
- 11609 Garrick Ave
- 11374 Hela Ave
- 11235 Sunburst St
- 11555 Eldridge Ave
- 0 Kagel Canyon Unit 25533613
- 11645 N Delft Ln
- 11715 Garrick Ave
- 0 Terra Vista Way
- 10824 Foothill Blvd
- 12008 East Trail
- 11377 Gladstone Ave
- 12047 Kagel Canyon Rd
- 12055 Kagel Canyon Rd
- 11870 Jouett St
- 11926 Kathyann St
- 11377 Osborne Place Unit 33
- 11377 Osborne Place
- 11377 Osborne Place Unit 3
- 11377 Osborne Place Unit 11
- 11377 Osborne Place Unit 14
- 11377 Osborne Place Unit 31
- 11377 Osborne Place Unit 19
- 11377 Osborne Place Unit 18
- 11377 Osborne Place Unit 16
- 11377 Osborne Place Unit 15
- 11377 Osborne Place Unit 13
- 11377 Osborne Place Unit 12
- 11377 Osborne Place Unit 10
- 11377 Osborne Place Unit 9
- 11377 Osborne Place Unit 8
- 11377 Osborne Place Unit 7
- 11377 Osborne Place Unit 6
- 11377 Osborne Place Unit 5
- 11377 Osborne Place Unit 35
- 11377 Osborne Place Unit 33