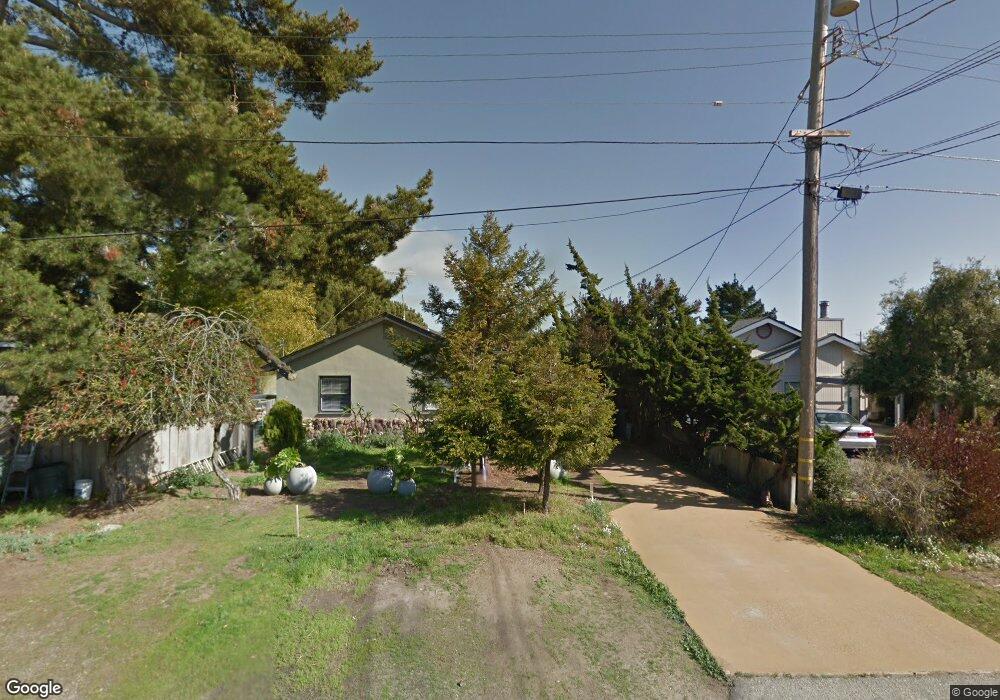
1138 16th St Los Osos, CA 93402
Estimated Value: $647,000 - $773,000
3
Beds
2
Baths
990
Sq Ft
$726/Sq Ft
Est. Value
About This Home
This home is located at 1138 16th St, Los Osos, CA 93402 and is currently estimated at $719,175, approximately $726 per square foot. 1138 16th St is a home located in San Luis Obispo County with nearby schools including Baywood Elementary School, Los Osos Middle School, and Morro Bay High School.
Ownership History
Date
Name
Owned For
Owner Type
Purchase Details
Closed on
Jun 11, 2003
Sold by
Burch Roy Allan and Burch Carol Jane
Bought by
Burch Roy Allan and Burch Carol Jane
Current Estimated Value
Home Financials for this Owner
Home Financials are based on the most recent Mortgage that was taken out on this home.
Original Mortgage
$205,000
Interest Rate
5.71%
Mortgage Type
Purchase Money Mortgage
Purchase Details
Closed on
May 29, 2003
Sold by
Burch Roy Allan and Burch Carol Jane
Bought by
Burch Roy Allan and Burch Carol Jane
Home Financials for this Owner
Home Financials are based on the most recent Mortgage that was taken out on this home.
Original Mortgage
$205,000
Interest Rate
5.71%
Mortgage Type
Purchase Money Mortgage
Create a Home Valuation Report for This Property
The Home Valuation Report is an in-depth analysis detailing your home's value as well as a comparison with similar homes in the area
Home Values in the Area
Average Home Value in this Area
Purchase History
| Date | Buyer | Sale Price | Title Company |
|---|---|---|---|
| Burch Roy Allan | -- | Fidelity National Title Co | |
| Burch Roy Allan | -- | Fidelity Title Company |
Source: Public Records
Mortgage History
| Date | Status | Borrower | Loan Amount |
|---|---|---|---|
| Closed | Burch Roy Allan | $205,000 |
Source: Public Records
Tax History
| Year | Tax Paid | Tax Assessment Tax Assessment Total Assessment is a certain percentage of the fair market value that is determined by local assessors to be the total taxable value of land and additions on the property. | Land | Improvement |
|---|---|---|---|---|
| 2025 | $5,462 | $262,345 | $169,950 | $92,395 |
| 2024 | $6,103 | $257,202 | $166,618 | $90,584 |
| 2023 | $6,103 | $252,159 | $163,351 | $88,808 |
| 2022 | $5,663 | $247,216 | $160,149 | $87,067 |
| 2021 | $5,591 | $242,369 | $157,009 | $85,360 |
| 2020 | $5,044 | $239,885 | $155,400 | $84,485 |
| 2019 | $4,832 | $235,182 | $152,353 | $82,829 |
| 2018 | $4,808 | $230,571 | $149,366 | $81,205 |
| 2017 | $4,912 | $226,051 | $146,438 | $79,613 |
| 2016 | $3,348 | $221,619 | $143,567 | $78,052 |
| 2015 | $3,312 | $218,291 | $141,411 | $76,880 |
| 2014 | $3,114 | $214,016 | $138,641 | $75,375 |
Source: Public Records
Map
Nearby Homes
Your Personal Tour Guide
Ask me questions while you tour the home.