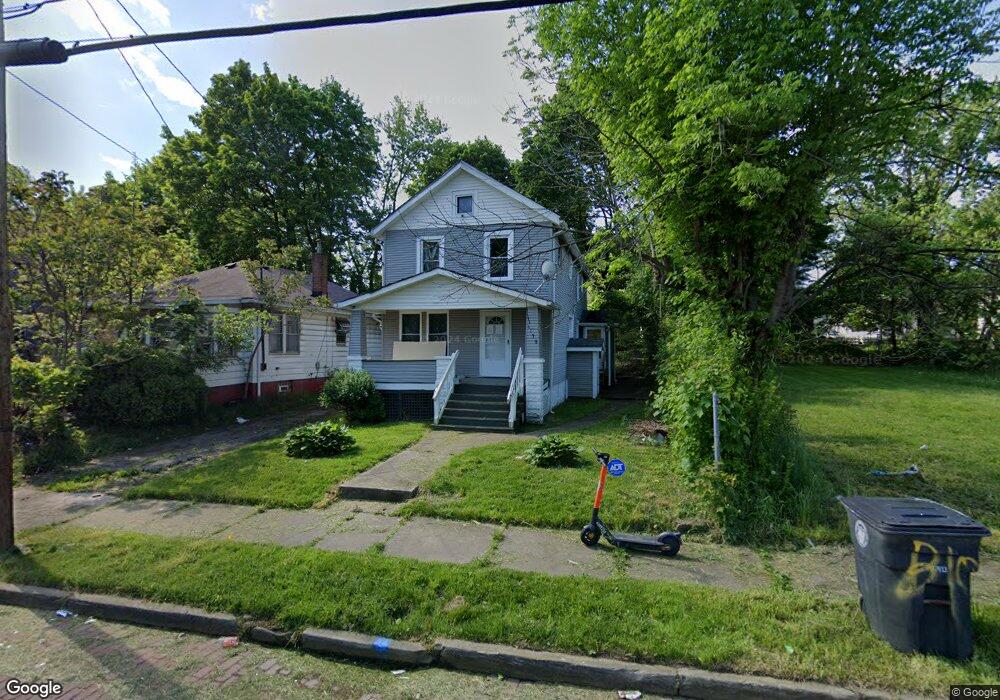
1138 7th Ave Akron, OH 44306
East Akron NeighborhoodEstimated Value: $80,000 - $128,000
5
Beds
2
Baths
1,440
Sq Ft
$67/Sq Ft
Est. Value
About This Home
This home is located at 1138 7th Ave, Akron, OH 44306 and is currently estimated at $97,007, approximately $67 per square foot. 1138 7th Ave is a home located in Summit County with nearby schools including Case Preparatory Academy, Akron Preparatory school, and Middlebury Academy.
Ownership History
Date
Name
Owned For
Owner Type
Purchase Details
Closed on
Jan 31, 2022
Sold by
Skipper and Eddie
Bought by
Gray Asia
Current Estimated Value
Purchase Details
Closed on
Jun 21, 2002
Sold by
Singleton Barbara and Singleton Barbara
Bought by
Skipper Eddie and Skipper Barbara
Home Financials for this Owner
Home Financials are based on the most recent Mortgage that was taken out on this home.
Original Mortgage
$55,250
Interest Rate
6.93%
Create a Home Valuation Report for This Property
The Home Valuation Report is an in-depth analysis detailing your home's value as well as a comparison with similar homes in the area
Home Values in the Area
Average Home Value in this Area
Purchase History
| Date | Buyer | Sale Price | Title Company |
|---|---|---|---|
| Gray Asia | $7,790 | None Listed On Document | |
| Skipper Eddie | -- | Miller Examining Service Inc |
Source: Public Records
Mortgage History
| Date | Status | Borrower | Loan Amount |
|---|---|---|---|
| Previous Owner | Skipper Eddie | $55,250 |
Source: Public Records
Tax History Compared to Growth
Tax History
| Year | Tax Paid | Tax Assessment Tax Assessment Total Assessment is a certain percentage of the fair market value that is determined by local assessors to be the total taxable value of land and additions on the property. | Land | Improvement |
|---|---|---|---|---|
| 2025 | $1,646 | $12,989 | $3,052 | $9,937 |
| 2024 | $841 | $12,989 | $3,052 | $9,937 |
| 2023 | $1,646 | $12,989 | $3,052 | $9,937 |
| 2022 | $536 | $7,148 | $1,796 | $5,352 |
| 2021 | $241 | $2,727 | $1,796 | $931 |
| 2020 | $422 | $5,520 | $1,800 | $3,720 |
| 2019 | $705 | $8,920 | $4,080 | $4,840 |
| 2018 | $696 | $8,920 | $4,080 | $4,840 |
| 2017 | $716 | $8,920 | $4,080 | $4,840 |
| 2016 | $716 | $9,040 | $4,080 | $4,960 |
| 2015 | $716 | $9,040 | $4,080 | $4,960 |
| 2014 | $710 | $9,040 | $4,080 | $4,960 |
| 2013 | $754 | $9,860 | $4,080 | $5,780 |
Source: Public Records
Map
Nearby Homes