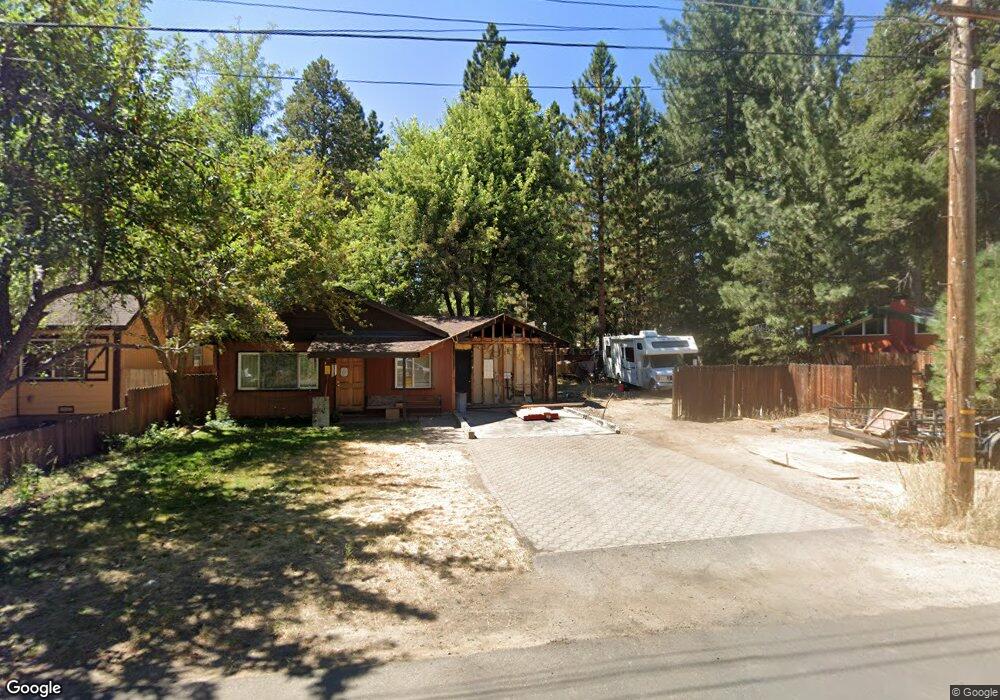
1138 Dedi Ave South Lake Tahoe, CA 96150
Estimated Value: $396,000 - $472,114
3
Beds
1
Bath
1,029
Sq Ft
$439/Sq Ft
Est. Value
About This Home
This home is located at 1138 Dedi Ave, South Lake Tahoe, CA 96150 and is currently estimated at $452,029, approximately $439 per square foot. 1138 Dedi Ave is a home located in El Dorado County with nearby schools including Bijou Community, South Tahoe Middle School, and South Tahoe High School.
Ownership History
Date
Name
Owned For
Owner Type
Purchase Details
Closed on
Sep 9, 2025
Sold by
Janice Mark Trust and Sheets Mark
Bought by
Janice Mark Trust and Sheets
Current Estimated Value
Purchase Details
Closed on
Dec 9, 2016
Sold by
Sheets Mark A
Bought by
Sheets Mark and Manning Janice
Purchase Details
Closed on
Jul 27, 1998
Sold by
Sheets Mark A
Bought by
Sheets Mark A and Manning Janice R
Home Financials for this Owner
Home Financials are based on the most recent Mortgage that was taken out on this home.
Original Mortgage
$85,600
Interest Rate
6.9%
Purchase Details
Closed on
Sep 29, 1997
Sold by
Landrum Kristopher and Landrum Jackie
Bought by
Sheets Mark A
Home Financials for this Owner
Home Financials are based on the most recent Mortgage that was taken out on this home.
Original Mortgage
$95,000
Interest Rate
7.44%
Purchase Details
Closed on
Sep 26, 1994
Sold by
Larm Jackie R
Bought by
Landrum Kristopher and Landrum Jackie
Create a Home Valuation Report for This Property
The Home Valuation Report is an in-depth analysis detailing your home's value as well as a comparison with similar homes in the area
Home Values in the Area
Average Home Value in this Area
Purchase History
| Date | Buyer | Sale Price | Title Company |
|---|---|---|---|
| Janice Mark Trust | -- | Placer Title | |
| Sheets Mark | -- | None Available | |
| Sheets Mark A | -- | None Available | |
| Sheets Mark A | -- | Fidelity National Title Co | |
| Sheets Mark A | $102,500 | First American Title Co | |
| Landrum Kristopher | -- | -- |
Source: Public Records
Mortgage History
| Date | Status | Borrower | Loan Amount |
|---|---|---|---|
| Previous Owner | Sheets Mark A | $85,600 | |
| Previous Owner | Sheets Mark A | $95,000 |
Source: Public Records
Tax History Compared to Growth
Tax History
| Year | Tax Paid | Tax Assessment Tax Assessment Total Assessment is a certain percentage of the fair market value that is determined by local assessors to be the total taxable value of land and additions on the property. | Land | Improvement |
|---|---|---|---|---|
| 2025 | $1,723 | $163,634 | $39,903 | $123,731 |
| 2024 | $1,723 | $160,426 | $39,121 | $121,305 |
| 2023 | $1,693 | $157,281 | $38,354 | $118,927 |
| 2022 | $1,675 | $154,198 | $37,602 | $116,596 |
| 2021 | $1,648 | $151,175 | $36,865 | $114,310 |
| 2020 | $1,624 | $149,625 | $36,487 | $113,138 |
| 2019 | $1,615 | $146,692 | $35,772 | $110,920 |
| 2018 | $1,578 | $143,817 | $35,071 | $108,746 |
| 2017 | $1,552 | $140,998 | $34,384 | $106,614 |
| 2016 | $1,520 | $138,234 | $33,710 | $104,524 |
| 2015 | $1,442 | $136,159 | $33,204 | $102,955 |
| 2014 | $1,442 | $133,494 | $32,554 | $100,940 |
Source: Public Records
Map
Nearby Homes
- 1087 Dedi Ave
- 1099 Tata Ln
- 1197 Julie Ln
- 1080 Julie Ln Unit 136
- 1080 Julie Ln Unit 255
- 1080 Julie Ln Unit 68
- 1080 Julie Ln Unit 79
- 1080 Julie Ln Unit 16
- 1080 Julie Ln Unit 120
- 1080 Julie Ln Unit 183
- 1080 Julie Ln Unit 137
- 1080 Julie Ln Unit 199
- 1080 Julie Ln Unit 67
- 1080 Julie Ln Unit 140
- 1223 Bonanza Ave Unit 7
- 1232 Julie Ln
- 1259 Dedi Ave
- 1331 Emerald Bay Rd
- 1259 Bonanza Ave
- 1124 Tata Ln
- 1142 Dedi Ave
- 1134 Dedi Ave
- 1141 Margaret Ave
- 1148 Dedi Ave
- 1145 Margaret Ave
- 1133 Margaret Ave
- 1143 Dedi Ave
- 1131 Dedi Ave
- 1137 Dedi Ave
- 1127 Margaret Ave
- 1147 Dedi Ave
- 1124 Dedi Ave
- 1153 Margaret Ave
- 1153 Dedi Ave
- 1156 Dedi Ave
- 1123 Margaret Ave
- 1125 Dedi Ave
- 1120 Dedi Ave
- 1140 Margaret Ave
- 1136 Margaret Ave