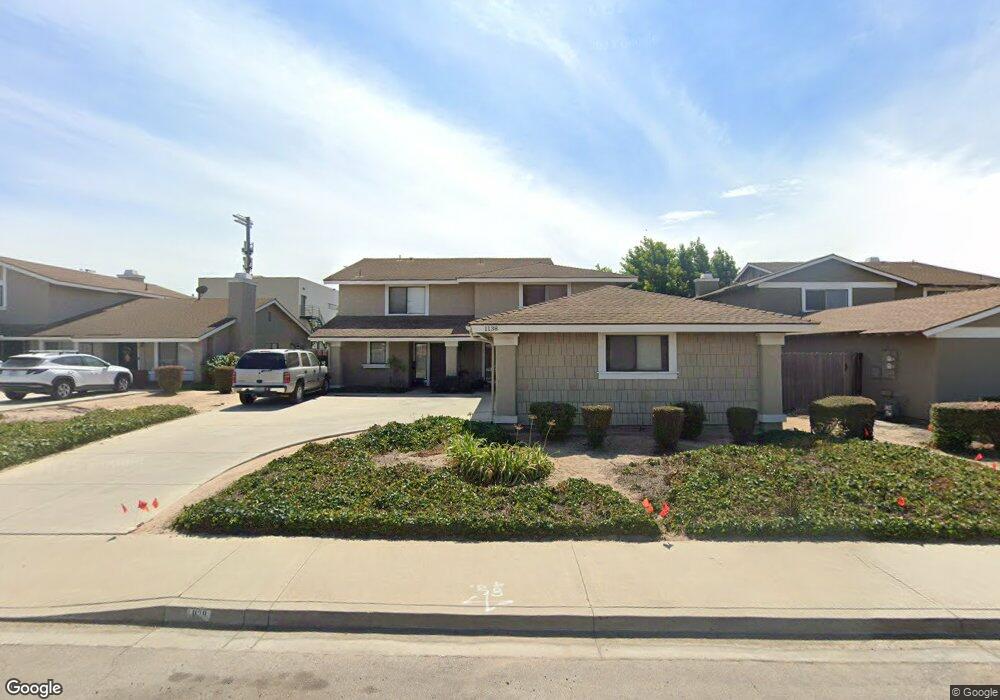
1138 E Foster Rd Unit A Santa Maria, CA 93455
Estimated Value: $467,000 - $538,000
3
Beds
3
Baths
1,708
Sq Ft
$300/Sq Ft
Est. Value
About This Home
This home is located at 1138 E Foster Rd Unit A, Santa Maria, CA 93455 and is currently estimated at $512,340, approximately $299 per square foot. 1138 E Foster Rd Unit A is a home located in Santa Barbara County with nearby schools including Ralph Dunlap Elementary School, Orcutt Junior High School, and Ernest Righetti High School.
Ownership History
Date
Name
Owned For
Owner Type
Purchase Details
Closed on
Jun 30, 2025
Sold by
Kamiya Jason K
Bought by
Jason And Marina Kamiya Family Trust and Kamiya
Current Estimated Value
Purchase Details
Closed on
May 19, 2025
Sold by
Kamiya Family Trust and Kamiya Jay
Bought by
Kamiya Jason K
Purchase Details
Closed on
Aug 8, 2001
Sold by
Kamiya Jerald K and Kamiya Dawn C
Bought by
Kamiya Jerald K and Kamiya Dawn C
Home Financials for this Owner
Home Financials are based on the most recent Mortgage that was taken out on this home.
Original Mortgage
$125,000
Interest Rate
7.1%
Mortgage Type
Purchase Money Mortgage
Purchase Details
Closed on
Jun 26, 2001
Sold by
Lyon Joanell
Bought by
Kamiya Jerald K and Kamiya Dawn C
Home Financials for this Owner
Home Financials are based on the most recent Mortgage that was taken out on this home.
Original Mortgage
$125,000
Interest Rate
7.1%
Mortgage Type
Purchase Money Mortgage
Create a Home Valuation Report for This Property
The Home Valuation Report is an in-depth analysis detailing your home's value as well as a comparison with similar homes in the area
Home Values in the Area
Average Home Value in this Area
Purchase History
| Date | Buyer | Sale Price | Title Company |
|---|---|---|---|
| Jason And Marina Kamiya Family Trust | -- | None Listed On Document | |
| Kamiya Jason K | -- | None Listed On Document | |
| Kamiya Jerald K | -- | Chicago Title Co | |
| Kamiya Jerald K | $175,000 | Chicago Title Co |
Source: Public Records
Mortgage History
| Date | Status | Borrower | Loan Amount |
|---|---|---|---|
| Previous Owner | Kamiya Jerald K | $125,000 |
Source: Public Records
Tax History Compared to Growth
Tax History
| Year | Tax Paid | Tax Assessment Tax Assessment Total Assessment is a certain percentage of the fair market value that is determined by local assessors to be the total taxable value of land and additions on the property. | Land | Improvement |
|---|---|---|---|---|
| 2025 | $3,733 | $474,300 | $204,000 | $270,300 |
| 2023 | $3,733 | $248,468 | $78,086 | $170,382 |
| 2022 | $3,625 | $243,597 | $76,555 | $167,042 |
| 2021 | $3,552 | $238,821 | $75,054 | $163,767 |
| 2020 | $3,521 | $236,373 | $74,285 | $162,088 |
| 2019 | $3,481 | $231,739 | $72,829 | $158,910 |
| 2018 | $3,429 | $227,196 | $71,401 | $155,795 |
| 2017 | $3,330 | $222,742 | $70,001 | $152,741 |
| 2016 | $3,222 | $218,376 | $68,629 | $149,747 |
| 2015 | $3,189 | $215,097 | $67,599 | $147,498 |
| 2014 | $3,046 | $210,884 | $66,275 | $144,609 |
Source: Public Records
Map
Nearby Homes
- 4080 Berwyn Dr
- 1120 Devonshire Place
- 1193 E Foster Rd Unit D
- 1193 E Foster Rd
- 1173 Sumner Place Unit D
- 4127 Glenview Dr
- 4171 Whispering Pines Dr
- 3920 U S 101
- 3822 Cherry Hill Rd
- 3874 Crestmont Dr
- 4005 Greenbriar Ct
- 1433 Woodmere Rd
- 1339 Shetland Ct
- 566 Parkview N
- 0 Northpoint Cir
- 3741 Les Maisons Dr
- 1053 Shultz Ln
- 426 Parkview N
- 3694 Corta Bella Way
- 4472 Harmony Ln
- 1138 E Foster Rd Unit B
- 1132 E Foster Rd
- 1132 E Foster Rd Unit B
- 1132 E Foster Rd Unit A
- 1144 E Foster Rd Unit B
- 1144 E Foster Rd Unit A
- 1126 E Foster Rd Unit A
- 1150 E Foster Rd Unit A
- 1150 E Foster Rd Unit B
- 4098 Berwyn Dr
- 1120 E Foster Rd Unit B
- 1120 E Foster Rd Unit A
- 1141 E Foster Rd
- 1141 E Foster Rd Unit D
- 1141 E Foster Rd Unit C
- 1141 E Foster Rd Unit B
- 1141 E Foster Rd Unit A
- 1156 E Foster Rd Unit A
- 4092 Berwyn Dr